Professional development (PD) can be instrumental in enhancing teachers’ mathematical instructional practices (National Mathematics Advisory Panel, 2008). However, in spite of the critical role that teachers’ mathematical knowledge plays in mathematics education, many teachers have limited understanding of fundamental concepts for which they are teaching, such as fractions and fraction operations (Fuller, 1997). Recognition of such limitations is necessary for creating effective PD that actively engages teachers and focuses on what teachers must know, as well as how they may apply such knowledge in their instructional practices (Darling-Hammond et al., 2017; Desimone et al., 2002). Such high-quality PD opportunities can improve teachers’ understanding of mathematics and their instructional practices, as well lead to improved student achievement in the teachers’ classrooms (Huffman et al., 2008).
A continually growing body of high-quality research on effective classroom instruction can inform the design of PD. For example, the Institute of Education Sciences (IES) has published multiple practice guides that provide research-based instructional strategies to assist teachers with meeting the needs of all learners in mathematics. These guides have included Teaching Math to Young Children (Frye et al., 2013), Improving Math Problem Solving in Grades 4-8 (Woodward et al., 2012), and Developing Fractions Instructions for K-8 (Siegler et al., 2010). The research-based skills, strategies, and instructional practices in these practice guides provide an outline and understanding for ways classroom instruction can be modified to improve learning outcomes and improve long-term mathematical understanding in students.
Problematically, access to high-quality PD is not equitable across the United States, and teachers in rural communities, in particular, frequently face fewer opportunities and multiple challenges to access support for ongoing PD (Darling-Hammond et al., 2017). For instance, rural teachers often must travel long distances from their home and stay for days in a remote location for training, because it is often not affordable or practical to bring onsite PD programming to a small number of teachers in rural districts, especially training of sustained duration (Glover et al., 2016). Thus, school systems must pay for registration and travel costs, as well as cover the salary of substitute teachers. Unfortunately, many of these school districts lack sufficient funding to cover such expenses, especially to send groups of teachers together, so their teachers do not receive the PD needed for them to enhance their instructional practices (Hansen, 2009).
Presently, the issues of access to PD that have long plagued rural districts are exacerbated by the COVID-19 pandemic. With face-to-face opportunities for PD more limited than ever, there is an overdemand on the few, if any, high-quality resources available to teachers. However, various forms of online PD that have emerged in recent years may move more to the forefront for the near future. Such opportunities may enable teachers in rural areas to receive the PD that has been lacking in their regions.
Microcredentials
One such emergent area of online PD is microcredentialing. In general, microcredentials provide a means to certify that a skill or set of knowledge has been obtained through the completion of an online learning experience. While microcredentials are constructed by a wide array of school systems, universities, corporations, and nonprofit organizations, they have several common features or components. Microcredentials are expected to be grounded in research, emphasize a competency-based experience, and allow for access anytime and anywhere. To verify mastery of the skills obtained in the microcredential, a certificate or digital badge is awarded that can be shared virtually (Yu et al., 2015). Unlike many face-to-face PD experiences that requires attendance for completion, badging provides documentation that a skill was mastered.
As microcredentials are a relatively new form of PD, little research is available about optimal forms of microcredentials (Demonte, 2017). Some research, however, has suggested that the flexibility of pacing and personalization of microcredentials meet a need for teachers seeking PD (Gamrat et al, 2014). Additionally, teachers often report after completing microcredentials that they believe the learned skills will help change and improve their current instructional practices (Acree, 2016).
These findings are especially important because microcredentials can provide access to high-quality PD to which many teachers in high-needs areas would not have access otherwise (Will, 2017). In addition, their potential for impact has greatly expanded since the COVID-19 pandemic limited face-to-face PD for months, if not years.
Research is still needed to understand the efficacy of microcredentials for improving teaching. It has been suggested that systematic research is needed to determine best practices for the content and delivery of microcredentials (DeMonte, 2017) and that such microcredentials may need to be part of a larger professional learning strategy to influence teachers’ instructional practices. Agencies, such as the U.S. Department of Education, have begun addressing this need for research by providing significant collaboration and funding for projects involving microcredentialing.
The emphasis of the Appalachian Support for Specialized Education Training (ASSET) program, the subject of the present study, was to provide PD through self-paced, online microcredentials and microcredential stacks in research-based best practices of elementary literacy and mathematics. The ASSET project was initiated to develop this program and contribute much-needed research and development concerning microcredentialing. This investigation specifically tested the individual effectiveness of two different ASSET microcredential courses in elementary mathematics — one about teaching fractions and the other about teaching word problems — and centered on addressing three main research questions:
RQ1. How effective is an online microcredential course about elementary mathematics fractions on improving participants’ understanding of teaching fraction concepts?
RQ2. How effective is an online microcredential course about elementary mathematics word problems on improving participants’ understanding of teaching word problems?
RQ3. What are teachers’ perceptions of their learning in online microcredential courses about elementary mathematics concepts?
The two microcredentials were selected for several reasons: (a) they were believed to have equal appeal among elementary school teachers, (b) they did not overlap each other in specific content, (c) both had been through an assessment validation process, and (d) both had shown some preliminary evidence of effectiveness in pilot research. The effectiveness of each course was to be compared to a similarly designed course focused on different mathematical content.
The third research question sought to reveal participants’ perceptions of their learning through the microcredential and their feedback about the likelihood of implementing the instructional practices learned throughout the microcredentials. While it is worthwhile for them to learn new practices, it is far more important that they have intention to apply their learning to effect change in the classroom.
Design Framework
The ASSET project’s Supporting Effective Educator Development (SEED) grant awarded from the U.S. Department of Education funded the creation and dissemination of an online PD program. It included the development, implementation, and evaluation of online, self-paced, competency-based education (CBE) microcredentials designed to increase teacher effectiveness and workforce capacity in underserved rural communities. Every ASSET microcredential is based on recommended strategies, tools, and resources from the IES What Works Clearinghouse (WWC) practice guides (https://ies.ed.gov/ncee/wwc/PracticeGuides).
The rationale behind utilizing these practice guides is their research-based emphasis on enhancing mathematical instructional practices in specific areas of K-8 mathematics. The developmental framework for each microcredential was grounded in four primary components: CBE, learning sciences, learning analytics, and simulation-based and gamified learning. Each of these components are briefly described in the subsections that follow.
Competency-Based Education
CBE is a pedagogical approach that uses the direct assessment of student learning as credit for education rather than a proxy measurement such as “seat time” (Council of Independent Colleges, 2015; Kelchin, 2015). When learners demonstrate mastery at the prescribed level, they are awarded credit (e.g., microcredential) for their learning, regardless of how long it may have taken them to attain and demonstrate this mastery.
Proponents of CBE assert that three interdependent outcomes accompany this shift away from time as a metric for learning:
- Increase in education access due to greater flexibility for working adults (e.g., practicing teachers).
- Decrease in time to academic credential.
- Subsequent decrease in cost for the nontraditional adult learner.
Although CBE has several delivery mechanisms (e.g., synchronous, asynchronous, and hybrid), the ASSET project focused on producing an online platform to deliver asynchronous, self-paced learning modules aligned with specific workplace competencies (i.e., skills and concepts), and on-demand personalized coaching support from content area experts. These instructional coaches were experienced educators who provided timely technical and content-related support via email, chat, or phone and provided feedback on participants’ reflection essays and discussion board posts. Coaches also monitored participant progress through the microcredentials and, if necessary, offered additional support and assessment opportunities to complete a given microcredential.
The CBE approach aligns closely with competency-based learning or mastery-learning approaches. Competency-based learning has been defined by Sturgis et al. (2011) as involving the following features, which align with the ways microcredentials were designed in the project:
- Participants advance upon mastery.
- Competencies include explicit, measurable, transferable learning objectives that empower participants.
- Assessment is meaningful and a positive learning experience for participants.
- Participants receive timely, differentiated support based on their individual learning needs.
- Learning outcomes emphasize competencies that include application and creation of knowledge, along with the development of important skills and dispositions. (p. 4)
Additional design features of the ASSET project microcredentials aligned with what research suggests are important for effective teacher PD (Darling-Hammond et al., 2017; Desimone et al., 2002). For example, through the addition of on-demand, personalized coaching from content area experts, ASSET provides timely support and feedback for learning. In addition, the microcredentials are content-focused, they use modeling and active learning strategies, and they embed reflection opportunities as part of the learning experience.
Learning Sciences
The learning sciences helped inform the instructional design of the microcredentials. The purpose of the learning sciences is both to understand the processes that result in better learning, and to use this understanding to construct learning environments that will help people learn better (Sawyer, 2006). Drawing upon the work of the National Research Council (2020), the ASSET project designed each microcredential to align with the research on how people learn, with a specific focus on creating a learning environment that was learner centered, assessment centered, community centered, and knowledge centered.
The microcredentials were learner centered in that they emphasized understanding and building upon the participants’ preexisting knowledge and provided personalized coaching support. They were assessment centered by providing participants frequent opportunities for reflection, revision, and feedback to support learning growth. Being community centered meant that the microcredentials provided opportunities to connect both within the microcredential with other participants in a safe environment, while also providing instances to reach out to the larger community beyond. Finally, the knowledge-centered aspect of the program maintained a cohesive structure of the microcredentials around foundational research-based concepts and the ways the microcredentials helped improve instructional practices related to these concepts.
Learning Analytics
Embedded within each microcredential is a learning analytics system. This system was designed to collect, produce, and share data about individual learners with the ASSET team to help coaches better meet the needs of individual learners and tailor the educational experience (Bienkowski et al., 2012; Xing et al., 2015). It included the construction of data dashboards that were used to provide insight into key learning strategies that could enhance the learning environment for the participants by sharing metrics of participant knowledge and participant behavior within the microcredential (e.g., viewing of instructional video, accessing resource documents, and number and duration of visits) as well as produce user profiles that could influence the assistance provided throughout the experience (Becker et al., 2018).
Simulation-Based and Gamified Learning
Last, the ASSET project integrates various forms of simulations and game-based learning into the structure and framework of each microcredential. This form of learning can provide an effective method for creating high levels of engagement while participants learn content and instructional practices (Kapp, 2012; Sitzmann, 2011). As part of each microcredential, participants follow a landing-page progression map that shows where they are and what they have completed. Within activities, participants receive instantaneous feedback to allow them react and revise as they learn. Additionally, successful completion of each module and microcredential earns participants badges that can be collected and shared with their colleagues and organizations.
Overview of a Microcredential
Utilizing our design framework, each microcredential was constructed through a similar process. First, the focus concept of the microcredential was determined based on common areas of instructional improvement, especially those defined in WWC practice guides (Frye et al., 2013; Siegler et al., 2010; Woodward et al., 2012). These documents were utilized because of their emphasis on substantive research in instructional practices, especially those which emphasize K-8 mathematics education.
The ASSET project has constructed over 15 microcredentials on numbers and operations, fractions, word problems, visual representations and manipulatives, proportional reasoning, algebraic thinking, geometric thinking, classroom management, foundations of literacy, and inclusive practices. While not all microcredentials emphasized a mathematical domain, there were strategic reasons for their inclusion as microcredentials. For example, the WWC recognized the enhancement of problem-solving skills within word problems as a significantly important area in improving teachers’ mathematical instruction (Woodward et al., 2012). Comparable WWC guides can be accessed for each of the other areas for which microcredentials were constructed (https://ies.ed.gov/ncee/wwc/PracticeGuides).
Each microcredential was designed to provide approximately 10 hours of continuing education units (CEUs) for professional development and relicensure purposes. Additionally, participants could build their own stacks of microcredentials that met their personal needs for professional growth. A stack of five completed microcredentials would earn not only 50 hours of CEUs, but also 1 hour of graduate credit, 10 completed microcredentials would earn 2 hours of credit, and 15 completed microcredentials would provide 3 graduate credit hours from the university’s school of education.
Every microcredential used the backwards-design instructional model to develop the targeted learning competencies and objectives (Wiggins & McTighe, 2005). Potential microcredential topics were first researched (as noted previously) using the IES WWC Practice Guides (https://ies.ed.gov/ncee/wwc/PracticeGuides), but also in conjunction with other authoritative sources such as the National Council of Teachers of Mathematics’ (NCTM, 2014) Principles to Action. Using the WWC practice guides and corresponding research as a template, competencies and objectives were constructed for each microcredential.
The competencies and objectives were specifically structured to provide measurable outcomes. They served as the basis of the construction process because they dictated the direction for integrating the research-based practices into an effective and cohesive microcredential for the learner. Each microcredential addressed three to four competencies, and every competency was followed by two to three objectives (see examples in Tables 1 and 3).
The competencies and objectives of each microcredential were used to develop its assessment of prior learning, module summative assessments, and microcredential summative assessment. These assessments were constructed to provide instantaneous feedback, which meant they had to consist of multiple choice, multiple select, and numeric responses.
To provide an opportunity for more robust assessment, each microcredential also included two authentic assessments that required participants to explain how the content they were learning would apply to their classroom instruction. These assessments were submitted either in discussion forums or individually submitted assignments that were graded by learning coaches using a rubric. Each authentic assessment was provided a grade on the rubric, as well as feedback to assist the participant with their learning and understanding of the material.
With the competencies, objectives, and assessments created for the microcredential, subject matter experts constructed appropriate content. Each microcredential was divided into modules, where each module directly addressed one competency. Additionally, each activity within the module was aligned to the objective or objectives. Many objectives started with direct instruction, primarily in the form of a video, followed by various formative activities. These videos included research-based tools, resources, methods, and instructional strategies related to a specific objective or objectives.
The formative activities were wide-ranging, including individual practice with feedback, videos of students completing tasks, and videos of teachers implementing specific strategies. For example, in one activity, participants watched a video of an early learner using blocks to solve a problem read aloud. They were then asked various questions about how the child used the blocks, its potential affordances and constraints, and what they might ask the child next (Figure 1). Every response to a question was followed by instantaneous feedback to help the participant better understand the application of the instructional practices within the given situation.
Figure 1
Image of Participant Activity in the Word Problems Microcredential

Microcredentials also provided access to a variety of online resources and tools that participants could take back into their classroom for use immediately. For example, participants were provided postcourse access of GeoGebra apps for use in their own elementary mathematics classes (e.g., https://www.geogebra.org/m/ewpvrbkz). Various versions of manipulatives were also created as PDF files so that participants could create paper-based versions if they did not have access to store-bought kits for use in their classroom.
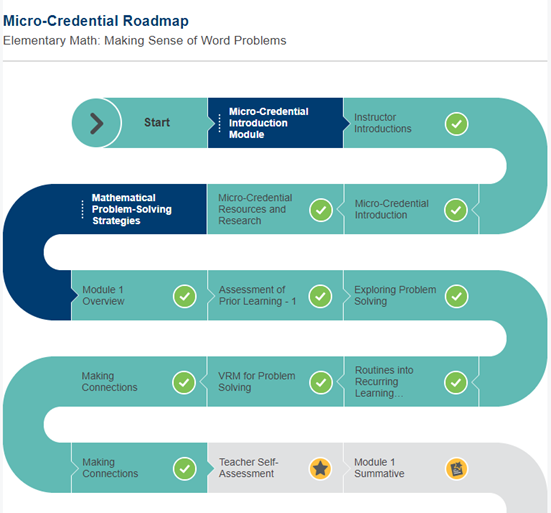
In addition, game-based learning was integrated into the online creation of each microcredential. When participants opened the microcredential, they were provided a visual progression map that included all activities that would be completed (see Figure 2). As they completed tasks in both the formative and summative assessments, they were provided feedback both instantly and from learning coaches. Additionally, as tasks were completed on the roadmap, a check appeared on the screen to reinforce completion. Successful completion of modules and microcredentials earned participants digital badges and certificates that they could export and share online and with their school district. Usage of such items in game-based learning show higher motivation and incentives for learning (Gibson et al., 2015; Yang et al., 2016). At all stages, the microcredential was constructed to help participants progress and understand what they had left to complete.
Figure 2
Example Progression Map for a Microcredential
Finally, every microcredential emphasized CBE. Participants could spend as little or as much time as they felt was needed within a module or microcredential. If they could show mastery of the content, they could progress. They also were able to complete the microcredential at their own pace. While some participants completed a microcredential in a few days, others would take weeks, as they had to fit it around their other obligations. To meet participants’ needs, coaches were available to respond to questions each evening 6 days a week. This support was perceived as necessary to help meet participants where they were, especially within the academic year.
Example of a Microcredential
One of the microcredentials constructed for the ASSET project was titled Elementary Math: Making Sense of Word Problems. When teachers logged into the learning management system (LMS) for a microcredential, they would see the microcredential roadmap (see Figure 2). Dark blue areas could be clicked to maximize or minimize modules of the microcredential. As activities within a module were completed, they turned from light grey to dark grey and earned a check mark to verify the activity had been completed. Figure 2 shows a portion of the roadmap for a participant who completed the introduction module and most of module 1, leaving two activities to be completed.
Most microcredentials followed a design similar to Making Sense of Word Problems, which included a baseline assessment of prior learning, four topic-specific modules, a reflection activity, and a summative assessment, which required an 80% pass rate to be awarded credit for the microcredential. The four modules addressed (a) enhancing problem solving skills with early learners (preK–2); (b) understanding word problem structures based on Cognitively Guided Instruction (CGI; Carpenter et al., 1999); (c) exploring problem solving strategies, such as use of visual representations and manipulatives, worked examples, think-alouds, and identifying important information; and (d) enhancing strategies for accommodations and modifications when utilizing word problems.
Each module began with an overview page. This page included an overview video created by a lead instructor, as well as text of the primary competency and its corresponding objectives for the module. Both videos and text were used on many microcredential pages to facilitate the participants’ multiple modes of learning. Additionally, videos were closed captioned for accessibility.
After the overview page, each module consisted of five to seven activities. They included videos created by a lead instructor to discuss a given topic within the competencies and objectives. These videos would include terminology, conceptual explanations of common mathematical methods, and multiple worked examples to assist with building participant understanding.
Proceeding activities would have the participants actively apply their learning, and feedback was always provided based on their responses. For example, Module 3 included an activity in which participants watched videos of elementary students solving word problems with the use of visual representations or manipulatives. Each video then had questions about how the tool enhanced or inhibited the students’ understanding and what other tools could be suggested for students to use for the given problem. These questions were multiple choice or multiple select so that the participant would receive instantaneous feedback related to their responses.
Other activities within the microcredential included written scenarios, student videos, opportunities to complete activities with age-appropriate tools, videos showing other teachers teaching using tools and strategies, and articles or resources discussing research-based instructional practices related to a given competency or objective. Every activity had questions attached in various forms that allowed for instantaneous feedback, which included multiple choice, multiple select, ordering, matching, and grouping. Feedback would provide explanations as to why a selected choice was correct or incorrect. However, incorrect responses were not provided with the correct response so that the participant could reconsider and try an activity again to build their personal understanding. For that reason, all formative activities could be repeated at any time within the microcredential.
At the completion of each module was a module assessment. This assessment was five to 10 questions, and it focused only on the single competency and its corresponding objectives. If a participant successfully completed the module assessment with a score of 80% or higher, they received a badge of completion that could be shared online. If not, they were given feedback on their errors. They were allowed to review the module and retake the module assessment to earn the badge if they desired. However, earning the badge was not required to move to the next module.
The microcredential summative assessment was constructed using similar types of questions to that of the formative activities. This approach allowed for instantaneous grading. Participants who did not meet the 80% threshold were contacted by a learning coach. The learning coach would examine areas of weakness based on module activities and incorrect summative questions. The coach would then suggest the participants review relevant modules or activities and would provide additional resources when necessary if participants struggled with a given concept.
Participants were expected to complete the suggested review before attempting the summative assessment again. This process would continue until participants met the 80% threshold. Successful completion provided participants with a microcredential badge and certificate for 10 CEUs that could be shared online and with their school district.
Method
Participants
A recruitment sample of over 12,225 teachers from the Appalachian counties of Kentucky, Ohio, and Pennsylvania was developed by searching district and school websites. The targeted minimum sample size for the study was 400 teachers. As an incentive, individuals were offered monetary compensation for their study participation. A total of 849 individuals completed the study screener questionnaire, which was used to determine eligibility for study participation. To meet eligibility criteria, individuals had to do the following:
- Not be already enrolled in the online ASSET PD program.
- Be currently employed as an elementary school teacher.
- Teach mathematics as part of their regular instructional responsibilities.
- Have access to a computer or tablet and reliable internet connectivity.
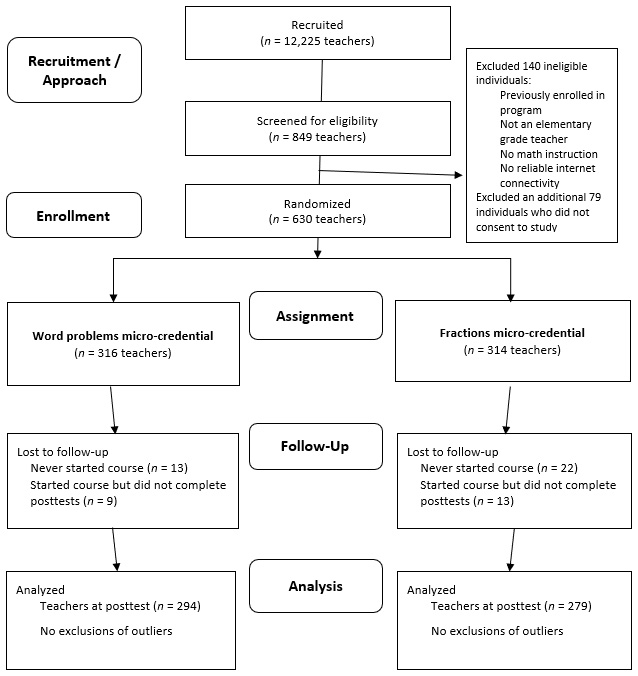
There were 770 teachers that met the eligibility criteria for the study, and 630 of those individuals consented to participate in the research study (see Figure 3 for participant flow chart). Each participant was randomly allocated to one of two groups in the study. One group was assigned to complete the microcredential course about teaching word problems(Word Problems MC), and the other group was assigned to complete the microcredential course about teaching fractions (Fractions MC).
Of the 316 participants in the Word Problems MC, 294 (93.04%) completed the study, and of the 314 in the Fractions MC, 279 (88.85%) completed the study. The overall attrition study attrition rate, 9.05%, and the differential attrition rate (4.19 percentage points) were deemed to be at acceptable levels.
Figure 3
Sampling and Flow of Participants
In addition, 65 study participants (about 11% of the analytic sample) were interviewed within 3 weeks after the completion of the microcredential (34 from the Fractions MC, 31 from the Word Problems MC). The recruitment samples were randomly selected from the participants in each study condition that had initially agreed to the interview at the start of the study. Using a median-split of the summative assessment scores, approximately half of each study condition’s interview sample was drawn from either the higher scoring group or the lower scoring group. In the completed interview sample, the Fractions MC sample had 17 high scorers and 17 lower scorers, and the Word Problems MC sample had 14 high scorers and 17 lower scorers.
The analytic sample was 94% female with the average age of 41. Just over three fourths had a master’s or higher degree, and 86% indicated they had previous online PD experience. The study’s background questionnaire asked participants to rate their level of comfort using technology on a 5-point scale, from 1 = not comfortable to 5 = very comfortable. Self-reported levels of comfort using technology were high (M = 4.31, SD = .72), which was expected since we advertised that it was an online PD program. Levels of comfort were not correlated with the study outcome measures.
Procedures
The microcredentials were offered on the same online learning platform in which they are normally housed. The online PD program’s microcredentials typically included an assessment of prior learning (i.e., pretest) and a microcredential summative assessment (i.e., posttest). All participants in the study completed the assessments for both courses; in other words, everyone responded to two sets of pretests and posttests — one for their assigned course and the other for the nonassigned course. For example, participants in the Word Problems MC group first completed the pretest of the fractions course, then completed the word problems pretest, followed by completing the course modules, then responded to the word problems posttest, and last completed the fractions posttest.
The two microcredentials were specifically selected for this study to mitigate overlap of concepts in teaching elementary mathematics. Competencies and objectives within each microcredential were unique, with the exception that both included the use of visual representations and manipulatives. Still, the particular visuals and manipulative tools explored were specific to each microcredential, and participants were assessed on their ability to identify the appropriate tools for a given instructional aim.
All participants were required to enroll first in the online PD program through the university. Once enrolled, participants were given access to their assigned microcredential course. Because the program’s microcredentials are designed to be self-paced, the study allotted a month for participants to complete all course and study requirements, which was estimated to require an average of 9 hours for either microcredential. The ongoing tracking of learners within the microcredential platform enabled individual outreach if progress was stalled.
Measures
The study utilized a mixed-methods approach. First, quantitative analysis was conducted to determine whether the participants learned significantly more due to completing the respective microcredential. Additionally, qualitative analysis was conducted to determine participant perceptions of learning in a microcredential format and of their potential for applying what they learned into their classroom instruction.
The summative assessments used in this study were administered as online, multiple-choice questionnaires within the microcredential platform. They were created as part of the overall development of the microcredentials, and each assessment had undergone a rigorous validation process that was utilized in the development of all microcredentials.
A collaborative, iterative process was used by the subject-matter experts and psychometricians to develop the assessments. They jointly made use of feedback that was systematically gathered by project researchers from panels of mathematics instruction experts who were external to the assessment development teams. The learning competencies and objectives targeted by each microcredential (see Tables 1 and 3) were used to design each assessment to ensure alignment between the intended learning outcomes of the microcredentials and their assessments.
During the development process, the alignment of individual items was also iteratively reviewed by the external mathematics instruction experts during periodic alignment workshops. The alignment workshops generated structured ratings that examined specific alignment between items and the microcredential objectives. Developed assessment items were first pilot tested in validation workshops with approximately 30 (teacher) participants to conduct a largely qualitative review for the purposes of gathering formative feedback and evidence regarding the face and content validity of items. The revised assessment items were then administered within the revised microcredential to several hundred participants, and the data were psychometrically analyzed to examine criterion, predictive, and construct validity evidence as well as internal and classification consistency estimates for scale reliability.
For predictive validity, hierarchical regression analyses were used to investigate how much variance in summative assessment performance was explained by the baseline assessment performance. IRT Rasch models were used to estimate the empirical reliability coefficients.
Knowledge of fractions instruction was measured with the baseline assessment (pretest)andthe summative assessment (posttest) that were embedded within the Fractions MC. Both instruments consisted of 30 multiple-choice items (single-choice only). All participants answered the same 30 pretest items. At posttest, however, participants were administered 30 novel questions randomly selected from a bank of 90 items. Table 1 shows information about the scoring and item counts for the fractions assessments, at both the competency level and the objective level. The Cronbach’s alpha coefficient of the fractions pretest was .72, indicating an acceptable level of measure reliability, or internal consistency.
Table 1
Item Count and Scoring for Competencies and Objectives: Fractions Assessments
| Competencies and Objectives | Item Count [a] |
|---|---|
| 1. Identify tools and strategies that build upon early learners’ intuitive understanding of fractions. | 8 |
| - 1.1. Use strategies and/or activities that connect fair sharing of a collection of objects to concepts of fractions. | 4 |
| - 1.2. Use strategies and/or activities that connect fair sharing of a single object to concepts of fractions. | 4 |
| 2. Identify tools and strategies to convey that fractions are numbers with magnitude. | 9 |
| - 2.1. Use number lines to represent fractions as numbers with magnitude. | 5 |
| - 2.2. Incorporate measurement tools into strategies and/or activities to represent fractions as numbers with magnitude. | 4 |
| 3. Explain how tools and strategies can be used to improve conceptual understanding of computational procedures with fractions. | 13 |
| - 3.1. Use visual representations and manipulatives to provide a connection between fraction operations and their underlying structures. | 5 |
| - 3.2. Identify appropriate methods for implementing estimation skills of reasonable solutions into problems with fractions. | 4 |
| - 3.3. Use real-world contexts and problems to connect fraction operations and their underlying structures. | 4 |
| TOTAL | 30 |
| [a] Each correctly answered question item was scored 1-point. | |
Analysis of the control group data showed a moderate correlation between the means of the fractions pretest and posttest, r = .58, p < .001 (see Table 2). Fractions pretest performance predicted 33% of fractions posttest performance.
Table 2
Correlations Between Pretests and Posttests: Overall and By Condition
| Test | 1 | 2 | 3 | 4 | |
|---|---|---|---|---|---|
| Overall Sample (n = 578) | |||||
| 1. Fractions Pretest | – | ||||
| 2. Word Problems Pretest | .435** | – | |||
| 3. Fractions Posttest | .509** | .315** | – | ||
| 4. Word Problems Posttest | .304** | .284** | .151** | – | |
| Fractions Microcredential (n = 279) | |||||
| 1. Fractions Pretest | – | ||||
| 2. Word Problems Pretest | .429** | – | |||
| 3. Fractions Posttest | .522** | .416** | – | ||
| 4. Word Problems Posttest | .347** | .285** | .359** | – | |
| Word Problems Microcredential (n = 299) | |||||
| 1. Fractions Pretest | – | ||||
| 2. Word Problems Pretest | .441** | – | |||
| 3. Fractions Posttest | .575** | .328** | – | ||
| 4. Word Problems Posttest | .322** | .279** | .381** | – | |
| **. Correlation is significant at the 0.01 level (2-tailed). | |||||
Knowledge of word problems instruction was measured with the course-embedded baseline assessment and summative assessment for the Word Problems MC. These assessments each included 33 multiple-choice question items, with a mixture of traditional multiple-choice question types (single-choice only) and multiple-response question types. On average, there were seven multiple-response questions on the pretest and between eight and nine on the posttest. The word problems pretest presented 33 randomly selected items from a bank of 66 items, and the posttest presented 33 randomly selected items from a bank of 167, which were not used for any other assessments. See Table 3 for further detail about the structure and scoring of the assessments.
Table 3
Item Count and Scoring for Competencies and Objectives: Word Problems Assessments
| Competencies and Objectives | Item Count [a] |
|---|---|
| 1. Select appropriate methods to teach early learners mathematical problem solving strategies. | 6 |
| - 1.1. Given descriptions of an early elementary classroom and a mathematical instructional task, identify processes for using common classroom routines to enhance problem solving skills. | 3 |
| - 1.2. Given a description of a math instructional task that requires early elementary students to engage in problem solving, identify how visual representations and manipulatives (VRM) can be used to teach prerequisite problem solving skills with early learners. | 3 |
| 2. Select appropriate methods to teach classification of word problem type and structure. | 9 |
| - 2.1. Given a selection of word problem types, identify which of the eight problem categories the word problem represents. | 3 |
| - 2.2. Given a selection of word problem types, determine the subcategory of the word problem to ascertain the type of unknown value for which to solve. | 3 |
| - 2.3. Given a selection of word problem types, create the corresponding equation most commonly connected to that given word problem category. | 3 |
| 3. Select appropriate methods to teach problem solving strategies based on word problem type and structure. | 12 |
| - 3.1. Given specific word problem instructional tasks, identify appropriate use of visual representations and manipulatives for problem solving. | 3 |
| - 3.2. Given specific word problem instructional tasks, identify appropriate use of worked examples for problem solving. | 3 |
| - 3.3. Given specific word problem instructional tasks, identify appropriate strategies for using the think-aloud method to teach students self-monitoring and reflection skills. | 3 |
| - 3.4. Given a variety of word problem types, identify strategies to teach students to distinguish between important and unimportant information in problems they are asked to solve. | 3 |
| 4. Select strategies, accommodations, and/or modifications for students who struggle with word problems because of difficulties with written text due to low reading level, linguistic diversity, or disability. | 6 |
| - 4.1. Given information about individual students’ needs, identify instructional accommodations for teaching word problems to struggling readers. | 3 |
| - 4.2. Given information about individual students’ needs, identify instructional modifications for teaching word problems to struggling readers. | 3 |
| Total | 33 |
| [a] Each correctly answered question item was scored 1-point. | |
For the control group data, the correlation between the pretest and posttest means of word problems was positive and statistically significant, and although small, r = .28, p < .001, was viewed to be at a reasonable level. Only about 8% of the word problems posttest performance was explained by pretest performance.
To examine teachers’ perceptions of learning and potential of applying instructional practices learned within the microcredential, we conducted semistructured interviews with a subsample of participants. This data was especially of interest since the study occurred during the summer of the pandemic when many schools had not determined plans for the upcoming academic year.
Participants who had successfully completed their respective microcredential were selected for several reasons. First, they experienced the entire learning opportunity within the microcredential. Second, they had demonstrated competency in what they learned because they had passed all microcredential requirements, including the summative assessment. Finally, by having a base-level of competency within their respective microcredential, it was perceived that they would have a better idea of what, if any, of the strategies and practices learned could be transferred to their classroom (either face-to-face or virtually due to the pandemic).
Due to pandemic protocols, all interviews were conducted by phone. The protocol included a series of 15 semistructured interview questions. They included questions that assessed participants’ responses to the use of a microcredential for PD (e.g., thoughts on the overall experience, including its appeal and challenges, comparison to other PD experiences, willingness to recommend the program to other educators, and recommendations for improvement). The interview also included questions about the perceived impacts of the PD (e.g., prior levels of skills and knowledge connected to the content of their completed microcredential, aspects of the PD that would have the greatest effect on their teaching, what they planned to do differently, and what impact they expected those changes to have on their students). All interviews were audio recorded and transcripts of those recordings were later used by researchers to identify themes in participants’ responses.
Analysis
This study involved two main impact tests to address the first two research questions. In addition to examining how completion of the microcredentials impacted teachers’ overall performance on the summative assessments, we also explored potential variation in effects at the level of individual course competencies. Further analyses explored potential subgroup differences in observed outcomes and whether time spent within the microcredential was associated with outcomes. All impact tests were analyzed using one-way analysis of covariance (ANCOVA) with pretest as a covariate (Dugard & Todman, 1995). An ANCOVA approach was selected (rather than an ANOVA on the change scores or a repeated-measures ANOVA) to reduce the likelihood of biased estimates and to improve statistical power compared to an unadjusted score analysis.
The large and relatively equal sample sizes, lessened concern about potential violations of assumptions for normality or homogeneity. Still, quantile-quantile plots were used to confirm that the posttest scores for both assessments were reasonably normally distributed. Residual plots supported the assumption of equality of variances. For the word problems posttest, Levene’s test showed the homoscedasticity assumption to have been met, F(1,576) = 1.59, p = .21. For the fractions posttest, Levene’s test indicated that the variances were not equal between the two groups, F(1,576) = 4.78, p = .029. As noted, however, we viewed our model as robust to this modest departure from the homoscedasticity assumption.
To address the third research question, a case study analysis of participants who completed the microcredentials was conducted (Creswell & Poth, 2017). The interviews of the randomly selected 65 participants were examined for common themes, similarities, or differences in the participants’ experiences. Initially, the interviews were separated based on the microcredential the interviewee completed. Each interview was examined by two or more members of the research team to produce potential themes from the individual interviews. These potential themes were then compared within the given microcredential grouping for primary themes. Finally, the primary themes from each microcredential grouping were compared to determine commonalities and differences. Thematic analysis resulted in only similar themes across the two microcredentials.
Results
Primary Impacts of the Fractions Microcredential
To address RQ1, an ANCOVA was conducted comparing the effectiveness of completing the Fractions MC to the control condition (completing the unrelated Word Problems MC) on participants’ understanding of teaching fractions. The test for the homogeneity of slopes revealed a statistically significant interaction between pretest and condition, F(1, 574) = 248.22, p = .019, thus indicating a violation of the noninteraction assumption.
A scatterplot of each group’s pretest and posttest scores is shown in Figure 4. The slight difference in group regression slopes indicated some difference in the effects of the fractions MC on posttest scores depending on pretest levels. The graphed results suggest the positive effects of the fractions MC on the fractions posttest assessment tended to be slightly greater among learners who performed lower on the pretest. For further examination, we computed outcome estimates for low, average, and high pretest values. Specifically, we estimated for 1 SD below the mean (17.00), the mean (20.93), and 1 SD above the mean (24.86). The estimated mean differences showed little practical difference in point value between lower and higher pretest scores (see Table 4).
Figure 4
Scatterplot of Pretest and Posttest Fractions Scores by Condition
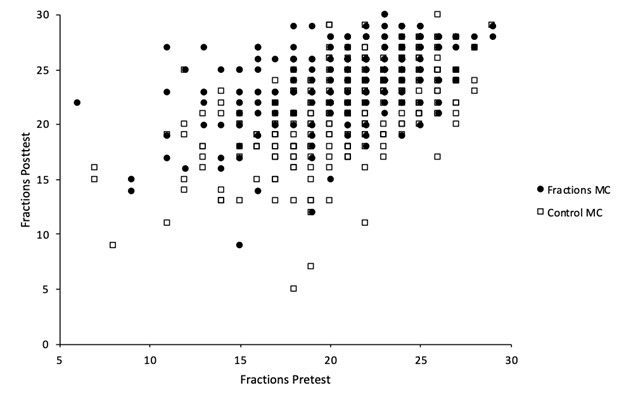
Table 4
Estimated Mean Differences in Fractions Posttest Scores for Lower, Average, and Higher Pretest Levels by Condition
| Pretest Score | Est. Mean Difference Between Condition | SE | Adj. 95% CI |
|---|---|---|---|
| Low: M – SD = 17.00 | 3.39 | .36 | 2.69, 4.09 |
| Average: M = 20.93 | 2.79 | .25 | 2.30, 3.29 |
| High: M + SD = 24.86 | 2.20 | .36 | 1.49, 2.90 |
| Note. CI = confidence interval. |
The results of the final ANCOVA model, which retained the condition and pretest interaction term, showed a significant, main effect of the Fractions MC on fractions, F(1,574) = 18.88, p < .001, and the pretest covariate was also significant, F(1, 574) = 5.51, p < .001 (see Table 4). The significant main effect of group indicated that the Fractions MC produced greater performance on the posttest compared to the control group. The partial eta squared value of .03 suggested the size of the main effect of fractions MC completion on posttest performance was small (Cohen, 1988).
Table 5
ANCOVA Results and Descriptive Statistics for Fractions by Condition and Pretest Scores
| Group | n | Mobs | SD | Madj | SE |
|---|---|---|---|---|---|
| Fractions MC | 279 | 24.18 | 3.28 | 24.20 | .18 |
| Control | 299 | 21.43 | 3.96 | 21.41 | .18 |
| Source | df | MS | F | p | ηp2 |
|---|---|---|---|---|---|
| Condition | 1 | 174.11 | 18.88 | <.001 | .032 |
| Pretest | 1 | 2288.84 | 5.51 | <.001 | .302 |
| Condition x Pretest | 1 | 50.77 | 248.22 | .019 | .010 |
| Error | 574 | 9.22 | |||
| Note. R2 = .39, Adj. R2 = .39. Maximum possible score is 30. | |||||
Primary Impacts of the Word Problems MC
The same ANCOVA approach was used to examine the effectiveness of the Word Problems MC using performances on the Making Sense of Word Problems Summative Assessment. The initial inclusion of an interaction term (pretest x condition) indicated there was no statistically significant interaction effect, F(1, 574) = .05, p = .82; therefore, the interaction term was excluded from the final model. Results indicated there was a positive, statistically significant effect of the Word Problems MC on participants’ understanding of teaching word problems, while controlling for pretest scores, F(1,575) = 142.89, p < .001 (see Table 6). The effect size ηp2 = .20 exceeded Cohen’s (1988) convention (.15) for a medium effect size. Thus, based on these results and the preceding results, both microcredentials in the study had statistically significant, positive effects on participants’ understanding of teachings for their respective mathematical content areas.
Table 6
ANCOVA Results and Descriptive Statistics for Word Problems by Condition and Pretest Scores
| Group | N | Mobs | SD | Madj | SE |
|---|---|---|---|---|---|
| Word Problems MC | 299 | 27.96 | 2.43 | 27.91 | .14 |
| Control | 279 | 25.48 | 2.54 | 25.53 | .14 |
| Source | df | MS | F | p | ηp2 |
|---|---|---|---|---|---|
| Condition | 1 | 812.12 | 142.89 | <.001 | .199 |
| Pretest | 1 | 282.65 | 49.73 | <.001 | .080 |
| Error | 575 | 5.68 | |||
| Note. R2 = .26, Adj. R2 = .26. Maximum possible score is 33. | |||||
Outcomes at the Level of Individual Learning Competencies
To delve further into the specific areas of impacts on understanding of instructional practices, we explored impacts on each of the individual learning competencies targeted by each microcredential (see Tables 1 and Table 3 for listings of the individual competencies). Separate statistical tests were conducted for each competency. The Benjamini-Hochberg correction for multiple comparisons (Benjamini & Hochberg, 1995) was applied to reduce likelihood of making a Type I error, with the false discovery rate set at .05. Results are presented in the following two subsections.
Impacts of Fractions MC on Learning Competencies
Analysis of covariance tests were used to test group differences for the three competency outcomes while controlling for overall pretest performance on the fractions assessment. The ANCOVA results suggested that the Fractions MC learners significantly outperformed the control group on the fractions posttest subscores for all three competencies (see Table 7). This result held true after using the Benjamini-Hochberg correction (Benjamini & Hochberg, 1995) for multiple comparisons within the domain. Effect sizes for competencies 1 and 2 (ηp2 = .05) were interpreted to be small, while the effect size for Competency 3 (ηp2 = .13) was medium sized (Cohen, 1988). Note that an interaction term was retained in the final ANCOVA for the second fractions competency since there was a statistically significant interaction between the overall pretest score and the intervention. See Table 8 for both unadjusted and adjusted group means.
Table 7
Analysis Covariance for Posttest Competencies by Intervention With Overall Pretest as Covariate: Fractions
| Source | SS | df | MS | F | p | η2 |
|---|---|---|---|---|---|---|
| Competency F.1 | ||||||
| - Fractions Pretest | 89.02 | 1 | 89.02 | 49.51 | <.001 | .08 |
| - Fractions MC | 53.07 | 1 | 53.07 | 29.52 | <.001 | .05 |
| - Error | 1033.83 | 575 | 1.80 | |||
| Competency F.2 | ||||||
| - Fractions Pretest | 208.75 | 1 | 208.75 | 141.22 | <.001 | .20 |
| - Fractions MC | 40.65 | 1 | 40.65 | 27.50 | <.001 | .05 |
| - Pretest x MC Interaction | 23.63 | 1 | 22.63 | 15.99 | <.001 | .03 |
| - Error | 872.07 | 574 | 1.52 | |||
| Competency F.3 | ||||||
| - Fractions Pretest | 576.60 | 1 | 576.60 | 164.67 | <.001 | .22 |
| - Fractions MC | 310.28 | 1 | 310.28 | 88.61 | <.001 | .13 |
| - Error | 2013.36 | 575 | 3.50 | |||
| Note. The positive effects of the fractions microcredential remained statistically significant for all competencies after applying a Benjamini-Hochberg adjustment for the multiple testing. | ||||||
Table 8
Descriptive Statistics for Pretest, Unadjusted Posttest, and Adjusted Posttest: Fractions Competency Subscores
| Condition | n | Posttest Unadjusted | Posttest Adjusted | 95% CI | |||
|---|---|---|---|---|---|---|---|
| M | SD | M | SD | LL | UL | ||
| Competency F.1 | |||||||
| - Fractions MC | 279 | 6.23 | 1.37 | 6.23 | .08 | 6.08 | 6.39 |
| - Control | 299 | 5.63 | 1.42 | 5.63 | .08 | 5.48 | 5.78 |
| - Total | 578 | 5.92 | 1.43 | 5.93 | .06 | 5.82 | 6.04 |
| Competency F.2 | |||||||
| - Fractions MC | 279 | 8.07 | 1.09 | 8.08 | .07 | 7.93 | 8.22 |
| - Control | 299 | 7.36 | 1.59 | 7.36 | .07 | 7.22 | 7.50 |
| - Total | 578 | 7.71 | 1.42 | 7.72 | .05 | 7.62 | 7.82 |
| Competency F.3 | |||||||
| - Fractions MC | 279 | 9.87 | 1.90 | 9.89 | .11 | 9.67 | 10.12 |
| - Control | 299 | 8.43 | 2.31 | 8.42 | .11 | 8.21 | 8.63 |
| - Total | 578 | 9.13 | 2.24 | 9.89 | .11 | 9.67 | 10.11 |
| Note. CI = confidence interval; LL = lower limit; UL = upper limit. | |||||||
Impacts of Word Problems MC on Learning Competencies
The ANCOVA tests revealed statistically significant, positive effects of the Word Problems MC for three of the four learning competencies, Competencies 2–4 (see Table 9). These tests controlled for overall pretest performance on the fractions assessment, and p-values were corrected for the multiple comparisons. Group and overall outcome means for each competency are presented in Table 10. There was a medium effect size for Competency 2, while there were small effects for the other competencies.
Table 9
Analysis Covariance for Posttest Competencies by Intervention With Overall Pretest as Covariate: Word Problems
| Source | SS | df | MS | F | p | η2 |
|---|---|---|---|---|---|---|
| Competency WP.1 | ||||||
| - WP Pretest | 7.32 | 1 | 7.32 | 18.97 | <.001 | .03 |
| - WP MC | 1.00 | 1 | 1.00 | 2.58 | .109 | .00 |
| - Error | 221.89 | 575 | .39 | |||
| Competency WP.2 | ||||||
| - WP Pretest | 24.83 | 1 | 24.83 | 12.88 | <.001 | .02 |
| - WP MC | 176.13 | 1 | 176.13 | 91.34 | <.001 | .14 |
| - Error | 1108.71 | 575 | 1.93 | |||
| Competency WP.3 | ||||||
| - WP Pretest | 45.43 | 1 | 45.43 | 26.51 | <.001 | .04 |
| - WP MC | 80.37 | 1 | 80.37 | 46.90 | <.001 | .08 |
| - Error | 985.30 | 575 | 1.71 | |||
| Competency WP.4 | ||||||
| - WP Pretest | 5.68 | 1 | 5.68 | 6.54 | .011 | .01 |
| - WP MC | 27.71 | 1 | 27.71 | 31.89 | <.001 | .05 |
| - Error | 499.67 | 575 | .87 | |||
| Note. The positive effects of the word problems microcredential (WP MC) remained statistically significant for competencies two through four after applying a Benjamini-Hochberg adjustment for the multiple testing. | ||||||
Table 10
Descriptive Statistics for Pretest, Unadjusted Posttest, and Adjusted Posttest: Word Problems Competency Subscores
| Condition | n | Posttest Unadjusted | Posttest Adjusted | 95% CI | |||
|---|---|---|---|---|---|---|---|
| M | SD | M | SD | LL | UL | ||
| Competency WP.1 | |||||||
| WP MC | 299 | 5.43 | .59 | 5.42 | .04 | 5.35 | 5.49 |
| Control | 279 | 5.33 | .67 | 5.34 | .04 | 5.26 | 5.41 |
| Total | 578 | 5.38 | .63 | 5.38 | .03 | 5.33 | 5.43 |
| Competency WP.2 | |||||||
| WP MC | 299 | 6.69 | 1.36 | 6.67 | .08 | 6.51 | 6.83 |
| Control | 279 | 5.55 | 1.45 | 5.55 | .08 | 5.40 | 5.73 |
| Total | 578 | 6.14 | 1.51 | 6.12 | .06 | 6.00 | 6.23 |
| Competency WP.3 | |||||||
| WP MC | 299 | 10.43 | 1.28 | 10.42 | .08 | 10.27 | 10.56 |
| Control | 279 | 9.65 | 1.40 | 9.67 | .08 | 9.51 | 9.82 |
| Total | 578 | 10.05 | 1.39 | 10.04 | .05 | 9.93 | 10.15 |
| Competency WP.4 | |||||||
| WP MC | 299 | 5.41 | .92 | 5.40 | .05 | 5.30 | 5.51 |
| Control | 279 | 4.96 | .95 | 4.97 | .06 | 4.86 | 5.07 |
| Total | 578 | 5.19 | .96 | 5.18 | .04 | 5.11 | 5.26 |
| Note. CI = confidence interval; LL = lower limit; UL = upper limit. | |||||||
Exploration of Subgroup Differences
Additional two-way ANCOVA tests were conducted to explore whether there were any statistically significant mean differences on the two primary dependent variables between groups split on the two conditions and various subgroup factors, while controlling for pretest scores. However, nearly all the posthoc tests showed there to be no statistically significant differences in test outcomes. For example, there were no significant differences between states on either posttest: fractions – F(1, 573) = .413, p = .662; word problems – F(1, 573) = .615, p = .541. Participants with a masters or higher level degree performed similarly to participants with only a bachelor’s degree: fractions – F(1, 573) = .034, p = .854; word problems – F(1, 573) = 1.395, p = .238. While participants who had experienced online PD in the past had performed statistically higher on the fractions posttest than their peers (with pretest covariate) — F(1,573) = 3.90, p = .049 — there was no statistically significant difference on the word problems posttest, F(1,573) = .627, p = .429.
Participant Time Spent Within the Microcredentials
Due to the self-paced design of the microcredentials, time spent by learners within the microcredential platform was not expected to correlate with learning outcomes. Two data sources provided information about time spent within the microcredentials — one from analytics data tracked within the LMS and the other from self-report gathered via a brief postcourse questionnaire (administered within the LMS).
The data generated by the LMS provided estimates of the total time spent completing a microcredential. According to this data, participants averaged about 8-9 hours to complete either microcredential. For the Fractions MC condition, there was no statistically significant correlation between LMS-tracked time in the microcredential and performance on the fractions posttest (r = -.02, p = .686, n = 279). Visual inspection of scatterplots of LMS-tracked time by fractions performance confirmed the lack of an association between the two variables.
Similarly, in the word problems condition, there was no statistically significant correlation between the amount of time in the microcredential, as tracked within the LMS, and performance on the word problems posttest (r = -.10, p = .10, n = 299). Furthermore, visual inspection of the graphed data also demonstrated the lack of a relationship between time spent and posttest performance.
After completing the posttests, learners were asked to respond to a brief feedback questionnaire (within the LMS) about the microcredential. An item in the feedback questionnaire asked learners to report the amount of time they spent engaging on the LMS by selecting the amount from thirteen possible response options, ranging from 1 hour to More than 12 hours. The minimum number of hours to complete the microcredential was three, and the average was over nine hours. The final response category (more than 12 hours) limits our ability to know the uppermost range of hours, but based on coding the final response as 13 hours, the two conditions were statistically similar in self-reported hours to completion (fractions M = 8.59, SD =2.27; word problems M = 8.49, SD = 2.26). Notably, these averages were quite similar to the metric described above that was derived from the LMS. In the fractions MC condition, self-reported time spent in the LMS had a very small, but statistically significant negative correlation with performance on the fractions posttest (r = -.17, p = .009). For the word problems condition, there was essentially no correlation between self-reported time and the performance on the word problems posttest (r = -.09, p = .185). In summary, examination of both data sources of learning time spent in the microcredentials revealed only one statistically significant correlation, but the strength of the association was weak.
Participants’ Perceptions of the Microcredentials Experience
With positive quantitative results suggesting positive gains in knowledge of instructional practices for each respective microcredential group, case study analysis of participant interview data was used to understand participants’ perceptions of the learning experience and potential for implementation of what they learned. The analysis identified multiple commonalities in the experiences from both microcredential groups, such as an appreciation of the structure and pacing, the perceived engagement and effectiveness of the microcredentials, the impact of the PD experience, and the potential application of the microcredentials to their classroom instruction the following year. Unexpectedly, there were not diverging themes nor microcredential-specific themes. This finding suggests that these themes apply more broadly to the experiences of content-focused microcredentials developed by the ASSET program and not to a particular microcredential.
Structure and Pacing
Importantly, thematic analysis suggested that participants in both groups overwhelmingly found the structure of the microcredential positive and conducive to learning. One of the most appreciated aspects of the microcredential structure was that it was asynchronous and self-paced. Participants in both groups mentioned that this helped with their personal situations, especially during a pandemic. As one participant noted, “I can do it on my own time and not have to find child care.”
Many participants also felt that the self-pacing was supported by multiple features of the microcredential. Several stated that the road map laid out the course content and supported self-monitoring of learning progress. Within each activity, participants appreciated the ability to rewatch videos or complete formative activities unlimited times until they felt comfortable with the content being learned. One participant stated, “I was very interested in the videos. … I kept going back and trying to find a spot and replay it because I’m like, ‘I want to get this down so that I can put this to use.’”
Additionally, multiple participants stated that the quick responses by learning coaches helped them when an issue arose. The combination of a logical structure, self-paced learning, and the opportunity for as-needed assistance allowed many to feel confident in their ability to complete their respective microcredential.
Engagement
Participants in both groups perceived the content of each microcredential as highly engaging and interactive. Integrated with the structure, the chunking of material allowed participants to stay focused and engaged as they completed each of the activities. They reported that they appreciated that the activities used a variety of tools and programs. A fractions participant reflected, “GeoGebra was a very helpful online tool. If we have to go to virtual learning, that will be helpful to have as an available tool to use.”
Several teachers commented how they enjoyed the diversity of activities to avoid monotony. This included the use of short videos, interactive activities, the use of applets, and checking for understanding through short quizzes. As one participant stated, “I was never sitting there zoning out. I was always engaged.” Furthermore, participants believed the different feedback mechanisms were effective in maintaining their engagement throughout the microcredential. As another participant suggested, “I liked this because during the quizzes you got feedback and could go back in and take a look at things.”
Impact on Learning
Study participants overwhelmingly found the PD experience to be more impactful than many forms of PD they had received previously. They consistently cited the interactive engagement of the PD as a prime reason for its effectiveness. Several participants mentioned how different the experience felt because the microcredential forced them to be actively engaged throughout the entire learning process. As one stated, “Other PD’s were more listening, this one made me think.” Also, participants felt it was more impactful because the content was tailored directly to their teaching. They felt that it would directly influence their classroom instruction, which was infrequently the case in their school-based PD. As a participant noted, “Usually they try to generalize PD for the whole school. They try to make it fit everyone, and it doesn’t fit anyone. The ASSET program was more tailored.”
Moreover, participants felt that the structure and pacing of the microcredentials allowed them to reflect more on their individual teaching. The opportunity for pacing and reflection provided a perceived opportunity to learn more information and better understand the various tools and strategies discussed throughout each microcredential. As one participant stated, “I learned from [the microcredential], and I was able to reflect on my own teaching practice, how I did teach [concepts], and how I can change to make [them] better.”
Application of Learning
In both microcredentials, participants considered how the tools and strategies they were learning could apply to their classroom the coming year, especially with the pandemic’s impact on their mind. Interviewees anticipated that greater use of these strategies and manipulatives would foster deeper mathematical understanding among students. For example, several participants in the fractions microcredential planned to use the GeoGebra apps to teach fraction concepts, especially if they were teaching their classes online. A participant noted, “As I was going through the course, there were moments where I was thinking, ‘I wish I had this years ago.’”
Participants in both microcredentials also believed they now had more options of tools and strategies that they could implement in their classroom than they had before participation in the microcredential. For example, multiple word problems participants felt the use of worked examples and think-alouds would be impactful with their students. As one participant mentioned, “Covid has changed everything, but I can still do think-aloud sessions to understand what the kids are thinking.” A fractions participant found the reinforcement of estimation to be a great strategy as it “helps students check the reasonableness of their answer. The importance of estimation was sparked in me with the ASSET program.”
Another emphasis by participants was the use of multiple methods during instruction. Many felt that the microcredentials emphasized the relevance and effectiveness of utilizing multiple tools and strategies to teach the same concept. Teachers suggested they plan to offer multiple appropriate manipulatives, teach various strategies, and have students share more.
Discussion
The purpose of this study was to explore whether online PD in the form of microcredentials could positively improve teachers’ knowledge of instructional practices. Analysis of the assessment outcomes provided evidence of the effectiveness of online, asynchronous, self-paced microcredential courses in enhancing teacher knowledge of evidence-based practices in teaching mathematics.
First, the online microcredentials were effective in increasing participants’ understanding of teaching fractions and word problems, as measured by the fixed-response assessments. Confirmatory analyses of the microcredential summative assessments found both the Fractions MC and the Word Problems MC were effective in increasing instructional understanding of course content among the intervention group in comparison to the control group.
Second, knowledge gains were observed across many targeted learning competencies. Participants in the Fractions MC outperformed control group participants on all three competencies targeted and assessed by the course, while participants in the Word Problems MC outperformed their peers for three of the four competencies targeted and assessed by their course. Last, additional analyses showed the knowledge gains associated with each microcredential to be consistent across various subgroups and variables.This was true across measured demographic factors and background factors such as prior PD experiences or educational degrees. Both the self-reported data and the data tracked by the LMS showed that differences in the amount of time participants spent learning within the microcredential was not an important factor in their learning.
Follow-up interviews with teacher participants provided insights both into what features of the microcredentials were perceived to be most influential in increasing their knowledge, and the potential for how they may revise their classroom instruction based on what they learned in their respective microcredential. Thematic analysis of the interviews found that the asynchronous and self-paced learning features of the microcredentials made the PD more accessible and easier to complete within their available time. This finding was the same across both microcredentials, and it matches prior research pointing to teachers’ need for flexible pacing and personalization of PD (Gamrat et al., 2014).
The interview data in this study also helped to explain the impact of the microcredentials on increasing participants’ ability to describe and understand research-based pedagogical practices, as well as identify what practices and resources were perceived as most useful through actively engaging the participants throughout the entire PD process. This engagement resonated with many participants and left a positive impression of the opportunities to learn through online PD. The emphases of these microcredentials reinforce the expectations that any PD should match the needs of teachers, include active engagement, and provide opportunities for lasting impact (Bates & Morgan, 2018; Bayar, 2014).
Last, the interview analysis suggested that the microcredentials had a positive impact on participants’ perceived ability to implement evidence-based instruction aligned with the content of the microcredential into their classroom practices. This adds to research (Acree, 2016) that suggests microcredentials have a positive influence on teachers’ beliefs to improve their practice. However, as the pandemic removed opportunities to perform classroom observations to confirm such perceived impacts occurred the following academic year, further research is necessary to investigate whether, and in what ways, observable teacher classroom practice is influenced by the learning gains attained through the ASSET microcredentials and how such changes compare to other successful online PD opportunities (such as Goos et al., 2020).
Conclusions
Online PD has the opportunity to meet the needs of teachers in many regions and personal situations. While the ASSET program was developed to meet the needs of providing access to high quality PD in rural education (Glover et al., 2016; Hansen, 2009), due to the exacerbated issues surrounding education during a global pandemic, we view the findings as having broader significance. Districts across the nation have encountered pandemic-related travel restrictions, decreasing budgets, and higher teacher turnover. Online PD programs such as ASSET have the potential to address inadequate access to affordable, high-quality PD, which can have a positive effect on improving teachers’ knowledge of instructional practices. The learning opportunities afforded by the microcredentials of this study show that online, asynchronous PD can have a positive influence on teachers’ understanding of instructional practices and may lead to effective change in their classroom. Participating teachers’ enthusiasm toward the self-pacing, asynchronous format of the PD suggest that these opportunities should continue to be developed and disseminated to meet the needs of a diverse population of educators.
This study also helps address the need for research on microcredentials (DeMonte, 2017). Two key advantages of ASSET’s microcredential approach to PD is its accessibility and affordability. Microcredentials can provide teachers with shorter, effective, on-demand access to PD tailored to their specific learning needs for a lower cost than traditional methods such as graduate courses. The greater flexibility of microcredentials can decrease the time to complete licensure credentialing, which subsequently can help to reduce costs for the learner.
Within ASSET, the same design features used to construct the two microcredentials examined in this study are applied in the development of all the program’s microcredentials. In closing, the present study lends support to how an online, self-paced microcredential PD model can help confront the constraints that both geography and a changing teaching profession impose on not only rural educators, but all educators.
Author Note
This research was supported by funding from a U.S. Department of Education Supporting Effective Educator Development (SEED) grant award (No. U423A170051) to the Appalachian Support for Specialized Education Training (ASSET) program at Radford University. The content is solely the responsibility of the authors and does not necessarily represent the official views of the Department of Education.
References
Acree, L. (2016). Seven lessons learned from implementing microcredentials. Friday Institute for Educational Innovation at the NC State University College of Education.
Azano, A. P., & Stewart, T. T. (2015). Exploring place and practicing justice: Preparing preservice teachers for success in rural schools. Journal of Research in Rural Education, 30, 1-12.
Bates, C. C., & Morgan, D. N. (2018). Seven elements of effective professional development. Literacy Coaching and Professional Development, 71(5), 623 – 626.
Bayer, A. (2014). The components of effective professional development activities in terms of teachers’ perspectives. International Online Journal of Educational Sciences, 6(2), 319 – 327.
Becker, S. A., Brown, M., Dahlstrom, E., Davis, A., DePaul, K., Diaz, V., & Pomerantz, J. (2018). NMC horizon report: 2018 higher education edition. EDUCAUSE. https://library.educause.edu/~/media/files/library/2018/8/2018horizonreport.pdf
Benjamini, Y., & Hochberg, Y. (1995). Controlling the false discovery rate: A practical and powerful approach to multiple testing. Journal of the Royal Statistical Society Series B Methodological, 57, 289–300.
Bienkowski, M., Feng, M., & Means, B. (2012). Enhancing teaching and learning through educational data mining and learning analytics: An issue brief. US Department of Education, Office of Educational Technology.
Carpenter, T. P., Fennema, E., Franke, M. L., Levi, L., & Empson, S. B. (1999). Children’s mathematics: Cognitively guided instruction. Heinemann.
Cohen, J. (1988). Statistical power analysis for the behavioral sciences (2nd ed.). Lawrence Erlbaum Associates.
Council of Independent Colleges. (2015). Competency-based education. https://www.cic.edu/p/Securing-Future/Documents/CICBrief1-CBE.pdf
Creswell, J. W., & Poth, C. N. (2017). Qualitative inquiry and research design: Choosing among five approaches (4th ed.). Sage Publications.
Darling-Hammond, L., Hyler, M. E., & Gardner, M. (2017). Effective teacher professional development. Learning Policy Institute. https://files.eric.ed.gov/fulltext/ED606743.pdf
DeMonte, J. (2017). Micro-credentials for teachers: What three early adopters have learned so far. American Institutes for Research. https://www.air.org/resource/microcredentials-teachers-what-three-early-adopters-have- learned-so-far
Desimone, L. M., Porter, A. C., Garet, M. S., Yoon, K. S., & Birman, B. F. (2002). Effects of professional development on teachers’ instruction: Results from a three-year longitudinal study. Educational Evaluation and Policy Analysis, 24(2), 81–112. https://doi.org/10.3102/01623737024002081
Dugard, P., & Todman, J. (1995). Analysis of pre‐test‐post‐test control group designs in educational research. Educational Psychology, 15(2), 181-198. doi: 10.1080/0144341950150207
Frye, D., Baroody, A. J., Burchinal, M., Carver, S. M., Jordan, N. C., & McDowell, J. (2013). Teaching math to young children: A practice guide (NCEE 2014-4005). National Center for Education Evaluation and Regional Assistance (NCEE), Institute of Education Sciences, U.S. Department of Education.
Fuller, R. A. (1997). Elementary teachers’ pedagogical content knowledge of mathematics. Mid-Western Education Researcher, 10(2), 9–16.
Gamrat, C., Zimmerman, H. T., Dudek, J., & Peck, K. (2014). Personalized workplace learning: An exploratory study on digital badging within a teacher professional development program. British Journal of Educational Technology, 45, 1136–1148.
Gibson, D., Ostashewski, N., Flintoff, K., Grant, S., & Knight, E. (2015). Digital badges in education. Education and Information Technologies, 20, 403–410. https://doi.org/10.1007/s10639-013-9291-7
Glover, T. A., Nugent, G. C., Chumney, F. L., Ihlo, T., Shapiro, E. S., Guard, K., & Bovaird, J. (2016). Investigating rural teachers’ professional development, instructional knowledge, and classroom practice. Journal of Research in Rural Education, 31(3), 1–16. https://files.eric.ed.gov/fulltext/EJ1101917.pdf
Goos, M., O’Donoghue, J., Ní Ríordáin, M., Faulkner, F., Hall, T., & O’Meara, N. (2020). Designing a national blended learning program for “out-of-field” mathematics teacher professional development. ZDM Mathematics Education, 52, 893–905. https://doi.org/10.1007/s11858-020-01136-y
Hansen, J. W. (2009). Professional development in rural public schools: A review of literature (Unpublished doctoral dissertation). Northern Michigan University, Marquette, MI. https://www.nmu.edu/sites/DrupalEducation/files/UserFiles/Files/Pre-Drupal/SiteSections/Students/GradPapers/EdSpecialist/Hansen_Jim_EP.pdf
Huffman, D., Thomas, K., & Lawrenz, F. (2008). A collaborative immersion approach to evaluation capacity building. American Journal of Evaluation, 29(3), 358–368. doi:10.1177/1098214008318798
Kapp, K. M. (2012). The gamification of learning and instruction: game-based methods and strategies for training and education. John Wiley & Sons.
Kelchen, R. (2015). The landscape of competency-based education: Enrollments, demographics, and affordability. American Enterprise Institute. https://www.aei.org/wp-content/uploads/2015/01/Landscape-of-CBE.pdf
National Council of Teachers of Mathematics. (2014). Principles to actions: Ensuring mathematical success for all. Author.
National Mathematics Advisory Panel. (2008). Foundations for success: The final report of the National Mathematics Advisory Panel. U. S. Department of Education
National Research Council. (2000). How people learn: Brain, mind, experience, and school: Expanded edition. The National Academies Press. doi: 10.17226/9853
Sawyer, R. K. (Ed.). (2006). The Cambridge handbook of the learning sciences. Cambridge University Press.
Siegler, R., Carpenter, T., Fennell, F., Geary, D., Lewis, J., Okamoto, Y., Thompson, L., & Wray, J. (2010). Developing effective fractions instruction for kindergarten through 8th grade: A practice guide (NCEE No. 2010-4039). National Center for Education Evaluation and Regional Assistance, Institute of Education Sciences, U.S. Department of Education.
Sitzmann, T. (2011). A meta‐analytic examination of the instructional effectiveness of computer‐based simulation games. Personnel Psychology, 64, 489–528.
Sturgis, C., Patrick, S., & Pittenger, L. (2011). It’s not a matter of time: Highlights from the 2011 Competency-Based Learning Summit. International Association for K–12 Online Learning. https://eric.ed.gov/?id=ED537332
Wiggins, G. P., & McTighe, J. (2005). Understanding by design (2nd ed.). Association for Supervision and Curriculum Development.
Will, M. (2017, July 21). Rural Kentucky eyes microcredentials as a professional development solution. Education Week. http://blogs.edweek.org/teachers/teaching_now/2017/07/rural_kentucky_eyes_microcredentials_as_a_professional_development_solution.html
Woodward, J., Beckmann, S., Driscoll, M., Franke, M., Herzig, P., Jitendra, A., Koedinger, K. R., & Ogbuehi, P. (2012). Improving mathematical problem solving in grades 4 through 8: A practice guide (NCEE 2012-4055). National Center for Education Evaluation and Regional Assistance, Institute of Education Sciences, U.S. Department of Education. https://ies.ed.gov/ncee/wwc/practiceguides
Xing, W., Guo, R., Petakovic, E., & Goggins, S. (2015). Participation-based student final performance prediction model through interpretable genetic programming: Integrating learning analytics, educational data mining and theory. Computers in Human Behavior, 47, 168-181. doi: 10.1016/j.chb.2014.09.034
Yang, J. C., Quadir, B., & Chen, N. S. (2016). Effects of the badge mechanism on self-efficacy and learning performance in a game-based English learning environment. Journal of Educational Computing Resarch, 54(3), 371 – 394. doi: 10.1177/0735633115620433
Yu, L., Dyjur, P., Miltenburg, J., & Saito, K. (2015). Micro-credentialing: Digital badges in faculty professional development. In P. Preciado Babb, M. Takeuchi, M., & J. Lock (Eds.), Proceedings of the IDEAS: Designing Responsive Pedagogy Conference (pp. 82–89). Werklund School of Education, University of Calgary.
![]()