Catalyzing Change in High School Mathematics (National Council of Teachers of Mathematics [NCTM], 2018) called for a shift in the purposes of teaching mathematics from a focus solely on expanding professional opportunities to include understanding and critiquing the world. The Position Statement of the Association of Mathematics Teacher Educators (AMTE) on Technology (2022) stated that technology should be used “to advance equity and equitable teaching practices” by “providing additional ways to value and make visible students’ brilliance and diverse perspectives while providing access and opportunities” (Recommendation 1).
In this paper, we illustrate how these two stances can work together: how mathematical action technology that can perform mathematical tasks or respond to the user’s actions in mathematically defined ways (Dick & Hollebrands, 2011) can impact student learning. This, in turn, can help students develop their own mathematical identities and agency by engaging with data from a real issue: the wage gap. Our research question was as follows: In what ways can mathematical action technology used with a real-world context involving the wage gap contribute to students’ sense of identity and agency, that is, student actions and utterances indicative of building identity and agency?
We cite literature focused on identity and agency, discuss how multiple classes used TI-NspireTM technology to help students learn mathematics within a real-world context, and highlight instances where the technologies used in the classroom empowered students and enabled them to be doers of mathematics.
Literature Review
This literature review begins with some background on technology and teaching from a social oriented perspective, then makes connections to work on identity and agency and the related ideas of student noticing and figured worlds. To ground our thinking, we first consider technology and its role in analyzing big data and ways that might interface with a social-oriented perspective in teaching mathematics. The shift in the purpose of teaching mathematics, as recommended by NCTM (2018), can be seen as moving toward a more social-oriented perspective, where mathematics is connected to contexts that are relevant to students and their surrounding world (Engel, 2017; LaMar & Boaler, 2021). This shift is supported by research that suggests students are motivated to learn and have opportunities to build their mathematical identities when they (a) engage in tasks that address meaningful topics (Horn, 2017; Wager & Stinson, 2012); (b) use real data from real contexts (Neumann et al., 2013); (c) work on tasks they perceive as relevant to who they are as learners (Matthews, 2017); (d) address complex socio-political problems along with learning concepts and practices (Weiland, 2017); and (e) have some control over their work including options for choice (Anderson, 2016).
Such opportunities can be provided by aspects of data science, the science of learning from data (International Data Science in Schools Project, 2019) by engaging students in an investigative process: identifying a problem, considering data, processing data, exploring and visualizing the data, building a model and communicating results (Lee et al., 2022). Technology is an essential component of this process, central to managing the manipulations necessary to explore and visualize the data. The technology also serves as a bridge that enables all students to engage in the mathematics, removing barriers that often limit access (Moses & Cobb, 2001). Sacristan (2020) stated that using such open-ended technology-based tasks can give learners the opportunity for creativity and engagement in personally meaningful activities. Thus, technology, when intimately connected with data, can be used for a social-oriented purpose in teaching mathematics.
To frame our ideas on teaching with technology from a socially oriented perspective, we looked at several sources focusing on identity and agency (e.g., Darragh, 2016; Graven & Heyd-Metzuyanim, 2019; Langer-Osuna & Esmonde, 2017). Despite different perspectives and contexts, a common theme was the way mathematics is intertwined with social activity that directly affects the learning process. The discussion included the lack of theoretical and conceptual coherence despite identity being heavily studied, the vagueness of what identity means and how it can be operationalized, whether identity is static or a dynamic and constantly changing entity, and the differences between teacher and student identity research.
This does not account for the debate that ignites when considering whether mathematics (in terms of content) should be at the forefront when connected to identity work (Graven & Heyd-Metzuyanim, 2019). Given these considerations, we discuss the role of identity and agency in the work of teaching with interactive dynamic technology while attempting to be as clear as possible in response to Langer-Osuna and Esmonde’s call for transparency (2017).
Identity can be described using a variety of approaches that are not necessarily mutually exclusive, including participative, narrative, discursive, psychoanalytic, and performative (Darragh, 2016; Langer-Osuna & Esmonde, 2017). We think of identity as the fifth of these, a performative action that “is a result of the process of identifying, whether this is self-identification or identification by others,” which “keeps in mind the audience at all times as the ultimate identifier and enables us to consider the ways in which power is exerted in this recognition” (Darragh, 2016, Section 6, para. 5). Aguirre, et al. (2013) added to this notion of identity by connecting students’ identity to the ability to use mathematics in contexts related to who they are: “the dispositions and deeply held beliefs that students develop about their ability to participate and perform effectively in mathematical contexts and to use mathematics in powerful ways across the contexts of their lives” (p. 14).
Mathematical agency can be seen as the extent to which students are able to express and use their own ideas in solving mathematical problems (Boaler, 2002). We extend this and take agency to be when someone can use what they know to help them connect with and interrogate an aspect of their world; agency can be thought of as the outward expression of someone’s identity (Aguirre et al., 2013).
Accordingly, voice is where students are both heard and have a genuine impact (including in-class discussion). Speranzo and Tillema (2019) “view agency as building on voice” (p. 403). Some strategies they suggested for developing agency in classrooms include having tasks with multiple solutions that provide opportunities for decision-making and voice, asking students to revoiceothers’ thinking, asking students to agree or disagree, turn-and-talk to rehearse before group discussion, and allowing extensive wait times.
Two concepts related to identity and agency are student noticing and figured worlds, which were each generative in helping frame and think about this work. Student noticing can be used to engage students in a task with minimal teacher presentations. For our purposes, we framed noticing as “becoming intentionally aware of one’s actions and ideas” (Campbell & Yeo, 2023, p. 406; as cited in Mason, 2002), where noticing can improve both teaching and learning in classrooms (Campbell & Yeo, 2023; Goodwin, 1994; Jacobs et al., 2010; Lobato et al., 2012; van Es & Sherin, 2008).
While teacher noticing has received attention in research (Jacobs et al., 2010; van Es et al., 2022), student mathematical noticing has been less of a focus (Hohensee, 2016; Lobato et al., 2014) although Lobato et al. (2013) found that differences in students’ mathematical activity can potentially be explained through noticing. Recent work with eye tracking studies suggests a possible renewed focus on student noticing (e.g., Boals, 2023).
One particular aspect of student noticing that has become more visible is a Notice and Wonder approach (see https://www.nctm.org/noticeandwonder), which attempts to engage students in mathematics by posing situations and ideas to promote mathematical discussion without actually giving specific questions (Rumack & Huinker, 2019). Part of this involves developing tasks that are personally relevant to students’ lives, where the researcher and teacher start with some mathematical goal in mind before selecting data or task and a topic. After sharing the problem with the class, students think about it and then talk with a partner before a whole class discussion — in this way, everyone can be heard. A major focus of this method is on sharing ideas and not being right or wrong, emphasizing that each student has valuable contributions to make and creating a more equitable environment (Rumack & Huinker, 2019).
According to Rumack and Huinker, students who participated in noticing and wondering became more engaged with natural discourse and felt part of a group with real-world connections; the language of notice and wonder gave students an entry point. Noticing and Wondering also tends to increase the presence of student voice in the classroom and can facilitate student-centered and discourse-rich learning environments (Klein et al., 2019).
While having rich mathematical discussions in the classroom can be seen as potentially helpful for student learning, it is possible for such discussions to reinforce negative aspects. For example, students already confident in mathematics dominate discussions, and English learners might participate minimally and have difficulties explaining themselves (Turner et al., 2013). This view, however, is contradicted by Delevan and Madranga (2020), who conceptualized culturally and linguistically responsive Noticing and Wondering to increase accessibility and confidence in multilingual learners and to help teachers respond to the capabilities and needs of all students.
Because we were interested in the interactions within the class as students worked on the task, we also looked at the concept of figured worlds, which includes social settings where agents construct joint meanings, assume various rules, value certain outcomes, and form their own identity; the way one learns mathematics directly impacts what knowledge is produced (Boaler & Greeno, 2000). Essentially, the environment is inherently intertwined with the learning of mathematics, and the participation aspect is part of what learning mathematics is. Additionally, the idea of mathematics being definite and structured can be harmful, especially as students continue in the field; “Data from [the] study suggest that many students find the narrowly defined roles they are required to play within such curricula, incompatible with their developing identities” (Boaler & Greeno, 2000, p. 18).
Despite this work on identity (and related ideas), there is a gap between recommendations by educators about the importance of student identity in learning mathematics and what happens in practice (Berry & Larson, 2019). Many students have a negative perception of mathematics and their ability to do mathematics (Luttenberg et al., 2018), and this is reflected in young adults who often lack the necessary skills to engage in “meaningful participation in our democratic institutions” (Goodman et al., 2015, p. 5). Advocates argue that as part of developing student agency, cultivating mathematical curiosity and finding ways to engage students in activities related to their world should be emphasized in the teaching of mathematics (e.g., Berry & Larson, 2019; Su, 2019).
With this work on identity, agency, student noticing, and figured worlds as a framework, we explicitly examined how technology was used in high school classrooms in a lesson that engaged students in exploring a large data set related to median incomes. Weaving ideas of identity and agency, teaching from a socially oriented perspective, and technology into a figured world can open doors for students.
Methodology
Participants
The lesson was carried out by three high school teachers from different classes in different school environments; one was the lead author, and two were recruited by the lead author based on prior work with them. The teachers, all female, had from 16 to 20 years of teaching experience, and all were comfortable using TI graphing technology. The teachers chose which of their classes would be involved, and the school and the students or their families/guardians gave permission for the students to take part. One teacher used the lesson with 27 students in an algebra class (15 girls, 12 boys; all in Grade 9; 21 white, four Asian, two Black). A second teacher taught the lesson to 44 students taking either statistics or computer science (18 girls, 26 boys; 20 juniors, 24 seniors; 40 white, four Asian). The third teacher used the lesson with 23 students in statistics and quantitative reasoning courses (14 boys, nine girls; two juniors, 21 seniors; two Black, three Asian, one biracial, two Middle Eastern).
Data Collection and Analysis
To answer our question, students were given an open-ended activity involving large data sets related to the wage gap in median incomes that presupposed the need for technology. The study was observational in the sense that we were looking at case studies of the interactions between students’ use of technology as they engaged in an exploration of data that were meaningful to them and their stance as doers of mathematics and the role their voices played in the class. The data we collected consisted of student work, including captures of students’ computer or calculator screens (compiled in Google Doc folders for us to review); teachers’ written descriptions of the lessons; interviews with the teachers; recorded discussions with the teachers about the lesson; and postinterviews with teachers and selected students.
After the teachers had implemented the lesson, an in-person debrief was held, followed by a more intense debriefing during a recorded Zoom videoconference session.The interviews with the teachers were structured, with questions posed by the lead author, for example:
- Describe students’ initial reactions. “They worried they would have to do plotting by hand”; “They wanted me to tell them what to do”; “They looked to see themselves in the data.”
- Did anything unexpected happen during the class? “The class was upset because it looked like women’s incomes were increasing, but men’s were not”; “The class was the last hour before spring break, and the students worked bell to bell”; “No one made a scatterplot for a long time”; “Students were uncomfortable with ambiguity.” They wanted to know who was “right” (which relates to the defined classroom roles from Boaler and Greeno, 2000).
Because we wanted to understand aspects of the entire classroom (or milieu), including important features and interrelationships, negotiations between teachers and students, processes, resource utilization, and any other aspects of the environment that emerged, we used an illuminative approach (Gordon, 1991; Parlett & Hamilton, 1976). “A view of the dynamics of the whole, with its contradictions and issues, is [seen as] necessary to enable people to develop a more adequate sense of how to penetrate institutional structures and to inform practice.” (Popkewitz,1984, p. 48).
We independently analyzed students’ work, including screen captures from class computers or handhelds, noting different approaches students used in their analysis, the mathematics they used in these approaches, and the ways the approaches changed over time. In the second phase, we internalized our perspectives on agency and identity by revisiting the literature and agreed that students demonstrate mathematical agency when they engage in productive struggle, take risks to make their mathematical thinking visible, try different approaches, and are not afraid to change. They have a voice in the discussion, recognize that mathematics is a tool for understanding the world, and are in charge of their learning.
Having a positive mathematical identity means that students feel empowered by mathematics and, as doers of mathematics, are comfortable doing the mathematics and with the way others perceive them as doers of mathematics. They appreciate why mathematics is important in their lives (Aguire et al., 2013; LaMar, 2020; NCTM, 2018). We then looked for these aspects in what students did and how teachers responded in the different artifacts, which included coding student work and the teacher interviews and reports for references to instances in which student actions and conversations seemed to demonstrate agency and identity.
We compared notes, resolved differences by appealing to our agreed-upon perspectives of agency and identity, and raised questions to clarify details about the class and individual students. The next phase included videoconference discussions with the teachers to probe the descriptions of their observations, allowing us to ask questions such as, “Tell us how students handed in their reports. Did you give any advice before they handed them in?” The data included email exchanges when something was unclear (e.g., “How did a pair of students turn into three students?” “Simone’s partner left, and she joined another pair.”) The final phase of analysis was to share the results with the teachers for input and comment (e.g., pointing out an incorrect description of the technology or adding a biracial to a student’s background).
This illuminative approach (Gordon, 1991; Parlett & Hamilton, 1976) allowed us to consider the lesson as a whole, including how features such as the nature of the task, interactions among students, negotiations between teachers and students, teacher actions, and the ways in which the technology contributed to supporting and developing student agency and identity. Note that aspects of this study have been described in an earlier publication (Burrill et al., 2023) that focused on a detailed description of individual students as they interacted with the data.
The Lesson
The teachers were given a lesson template that offered students opportunities to explore their own questions (empowering students). The data given to the students (Figure 1) were the median income of full-time male and female workers aged 15 and older from 1960 to 2020, broken down by race, education level, and occupation. They are available online at Mathematical Modeling Data Science (https://education.ti.com/en/timathnspired/us/mathematical-modeling/data-science). The content involves linear relationships and mathematical modeling, with a focus on most state standards and on the essential concepts in Catalyzing Change (NCTM, 2018).
Figure 1
Median Yearly Income Data by Gender, Race, Occupation, and Education Level

The technologies used in the lesson were categorized as mathematical action technologies or conveyance technologies. According to Dick and Hollebrands (2011), mathematical action technologies are those that can perform mathematical tasks or respond to the user’s actions in mathematically defined way, as opposed to conveyance technologies, those used for transmitting or receiving information.
Mathematics action technologies used by the teachers in this study included TI-84s™, TI-Nspires™, and TI-Nspire™ software. The students had different degrees of familiarity with the devices, from using them for computations and graphing functions to statistical tests. None of them had used the technology to explore multivariate data. The conveyance technologies used were document cameras, Google Docs, and management systems that provide connections between the teacher’s computer and the students’ workspaces and allowed monitoring screen sharing and communication. Teachers in the study used the TI-Nspire Navigator™, which provides connections between the teacher’s computer and student handhelds, and LanSchool™, a platform for networked PCs that helps instructors manage multiple student PCs.
The lesson frame is described in the next section according to the mathematical objectives, the task given to students, and the preparation for the lesson.
Objectives
The lesson objectives varied by teacher, who chose subsets of the data depending on the background of the students and the focus of the class. These objectives included the following :
- Model a contextual situation mathematically and use the model to make a prediction.
- Represent two or more variables in a scatter plot and describe any relationships or patterns.
- Find and interpret linear equations to model relationships between two quantitative variables.
- Use proportional relationships to solve real-world problems.
Task
The tasks and the specific charges given to students were slightly different depending on the objectives, but essentially, all the classrooms focused on identifying a problem related to the median wage earned by workers aged 15 and older, analyzing data related to the problem, and drawing a conclusion explaining how the data supported the claim. Students were expected to share their work with the class and turn it in to the teacher.
Preparing for the Lesson
In preparation for the lesson, a videoconference session was held with the teachers, the lead author, and another mathematics educator to discuss the project and how the teachers might implement the lesson in their classes. Because the specific features related to student identity and agency described previously connect directly to the work in this study, the teachers were encouraged to begin the lesson by connecting the topic to students’ lives by engaging them with a question such as, “Do you think there are any inequities in the way people are paid for doing the same job? Why or why not?” After a discussion, the data would be given to the students using a sharing technology such as Google Classroom or a printed copy of the data tables, depending on the teacher.
To encourage student voice, one of our framing goals, the teachers were asked to have students “notice and wonder” about the data. The teachers anticipated students might question the data sources and credibility; why the wages are given in 2018 or 2020 dollars, or why the data are expressed using medians rather than means. The teachers agreed to instruct students to “play with” the technology and not tell them what to do with the devices but indicate they would answer questions students might have about how to perform a certain function. This initial meeting included sharing a set of teaching tips for working with large open-ended data sets with the teachers, which were discussed prior to the implementation of the lesson.
Teaching Tips
The lesson was open-ended and intended to engage students in investigating a real and relevant context (NCTM, 2018) using technology that would illustrate ways to value students’ ideas and diverse perspectives (AMTE, 2022). To support teachers in their facilitation of the lesson, the following tips, based on the lead author’s classroom experiences and supported by other researchers, were discussed with the teachers before implementing the task:
- Getting started: Students typically do not do well with broad open questions such as “Describe the gender wage gap”; they should formulate specific questions to help them focus on salient features (Arnold & Franklin, 2021). Because some try to do too much or investigate a question not appropriate for the data, having students submit a statement describing what they are going to investigate can prevent them from trying to do something that will not work, leading to frustration. The data should be useful in answering the question.
- Checkpoints: Students without much experience working with data or using mathematical action technology to do so often create graphs that do not make sense; typically, students may think bar graphs are the only way to go but often do not know how to create them on their device. Students often confuse categorical and quantitative data and try inappropriate approaches with categorical data, like finding a mean or making a scatter plot with categories on the horizontal axis. Rather than instruct the whole class before they start (then they all do bar graphs), have checkpoints throughout the lesson where students must share what they are doing to be sure they are moving in a positive direction (Heritage, 2007; Maynard et al., 2014).
- Summarizing: Students have difficulty communicating using both words and numbers, often using only numerical arguments because that is how they respond to typical mathematical tasks, calculating means and standard deviations, or writing the equation of a regression line without words to indicate what story they tell about the context. Discuss features of good summaries (Burrill & Dickson, 2023).
- Peer review: Having students review each other’s work and revise their own before turning it in can build community and give them agency (Nicol et al., 2014; Parke, 2017). However, to avoid feedback that is not useful (“It was a really nice report;” “I liked what you did”), give students specific questions with the goal to improve the response. For example, students might critique another’s work using sentence stems such as, “The work (a) is understandable and makes sense because …; (b) might have more details or clarification about …; (c) uses appropriate mathematical/statistical language, but I was a bit unsure when it said …; (d) left me a bit confused about …”
- Reflection: At the end of the lesson, after their work is turned in, ask students to reflect on what they learned doing the lesson (Branford et al., 2020; Hidayat et al., 2019); this is where the teacher can prompt those who learned something worthwhile to share (e.g., how to make a bar graph on TI-Nspire).
One of the questions in a postlesson interview was about the role of the teaching tips in preparing for the lesson. The teachers reported these were useful, although no one had time to do a peer review. They singled out frequent checkpoints as particularly important in “driving the lesson” because these enabled them to monitor the students and to develop student agency by connecting students with each other or anointing “tech reps” who shared expertise on performing a certain action on the Nspire. They suggested that summarizing might be expanded to provide insights into how to help students do a better job communicating their results.
The following sections describe two different approaches to the lesson and illustrate how the lesson can be used in different classrooms and for different learning objectives and how the technology supports equitable instruction. The discussion is structured to bring out the notions of agency and identity in a figured world, describing how the lesson was motivated, the ways in which students worked and what they did, and the teachers’ actions and perceptions.
Results
The first two teachers used the same lesson structure, Lesson A, while the third teacher used a different approach, Lesson B. Lesson A involves modeling a situation mathematically to make a prediction, while Lesson B involves describing and representing relationships between two or more variables.
Lesson A
Lesson A was used with students in beginning algebra, computer science, and statistics. The mathematical objective was to enable students to model a contextual situation mathematically and use the model to make a prediction and for the students in computer science and statistics to review and extend their understanding of modeling bivariate relationships. The lesson began by having students think individually about the question, as indicated in the lesson preparation described previously, “Do you think there is a difference in what men and women are paid for the same job?” and then share their thoughts. Students were divided; some remembered reading or hearing about the differences, while others indicated, in their experience, it seemed like everyone got the same pay for the same work.
Students were then given printed copies of the data in table form for men’s and women’s median incomes over time and asked what they noticed and wondered about. Student comments included, “Men make more than women, ” and “The numbers for both keep getting larger,” which led to “Maybe a graph would help.” The data were sent to the algebra students’ handhelds by a computer to calculator link and to the students in the upper grades via Google Classroom. Students worked in groups to analyze the data, considering whether the headline, “Women’s Income Is Catching Up to Men’s Income,” could be justified and, if so, to predict when the incomes will be equal. Most of the algebra students began by considering ratios or differences over the years, using their handhelds to produce graphs such as those in Figures 2 and 3.
Figure 2
Difference in Men’s and Women’s Median Income With Respect to Time

Figure 3
Ratio of Women’s to Men’s Median Income With Respect to Time
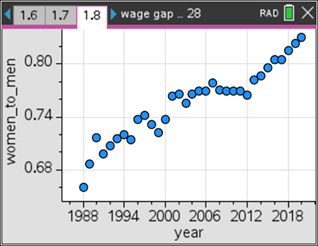
Eventually, one student, Braydon, tried making a scatter plot, which was quickly adopted as a strategy by others. Students shared their work by walking around and looking at each other’s calculator screens. They participated in animated discussions, arguing about approaches and details, such as what to do with the decimals in their answers when estimating the year in which the incomes would be equal. Articulating what the rate of change meant was a challenge, as several students thought of it only as slope without linking the value to the context.
The computer science and statistics students approached the task by considering linear models for the data. Students who began by graphing (year, men’s income), and (year, women’s income) were upset that men’s income appeared to decrease, then “flatline” over time with a slope of nearly 0, while women’s income appeared to steadily increase. The conversation shifted when one student put both graphs on the same axis (Figure 4) and noticed the gender gap, which was not obvious without a common scale. Student computer screens were visible on LanSchool, so other students quickly followed suit. Some students were concerned that the pattern in men’s income from year to year shifted around 1985 (Figure 4) and decided to work only with the data from 1985 on, while others advocated for a piecewise function.
Figure 4
Men’s and Women’s Median Income Over Time

Student approaches varied widely: using a slope triangle (Figure 5), “because it took 30 years to grow to be 10,000 so another 30 years from 1985 growing at the same rate, they will meet in 2045,” using least squares regression, finding the point of intersection using the trace function (Figure 6) or the equation solver (Figure 7); or creating a movable line (Figure 8). Some statistics students analyzed residuals (Figure 9) to determine whether the change in women’s earnings was actually linear and argued for another model. Some found a confidence interval for the slopes of the lines to make an interval estimate of the time when the earnings for men and women will be the same, while others used a significance test to check the slope for men’s income over time.
Figure 5
Reasoning From a Slope Triangle

Figure 6
Using Trace to Find the Intersection Point
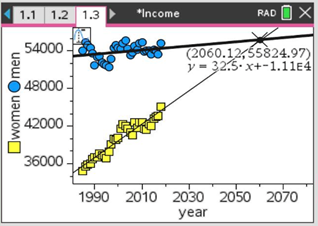
Figure 7
Using Equation Solver to Solve a System of Equations
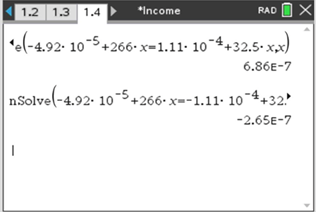
Figure 8
Creating a Moveable Line
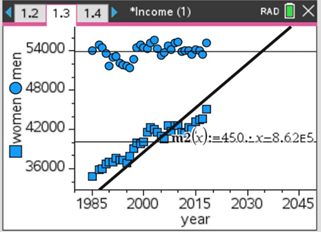
Figure 9
Checking the Residuals
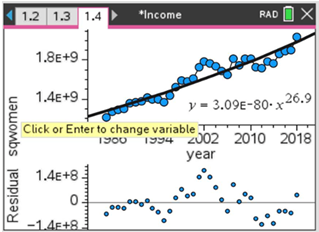
Both teachers began the lesson by asking students what they Noticed and Wondered, and both sequenced the work for discussion, grouping similar responses together (for example, graphical, numerical, algebraic, and statistical) and having students identify any differences. The teachers encouraged students to talk across groups, deliberately listening for ideas worth sharing. For example, one noticed Emilie using her arms to visually represent her view of what the slope of a line meant, which led to a class discussion related to Figure 6. Another example is when the teacher invited Alana, a typically quiet student, who found the moveable line tool, something no one else in the class had discovered, to share her thinking; others quickly involved her in their discussions (see Burrill et al., 2023 for details).
Here, one can see how the environment gave this student a voice to be heard — but not just heard. Emilie, Alana, and Braydon were able to share something unique that provided useful information for the whole class. Identity, described earlier as a performative action (e.g., sharing ideas in class) that involves being identified by others (e.g., positive class discussion), is on display here within this figured world of a classroom. Agency is visible in the number of different approaches students choose to use and their willingness to explore both the technology and the mathematics.
Lesson B
The teacher’s objective in Lesson B was to enable students to represent two or more variables in a scatter plot and describe any relationships or patterns. Students were given the data tables for the median income of full-time male and female workers aged 15 and older over time by race, education level, and occupation (Figure 1) via Google forms and asked to individually consider these questions: “What do you see?”; What are you curious about?”; and “What do you care about? (Figure 10). Then, students were to share in small groups before a whole class discussion. The third question was intentionally phrased to help students focus their investigation and to encourage independent thinking. After discussion, the TI-Navigator was used to send the data to students’ TI-Nspires, and students, working individually or in pairs, were instructed to “decide on a graph to explore, then write a short description about your findings.”
Figure 10
Three Questions to Begin the Lesson
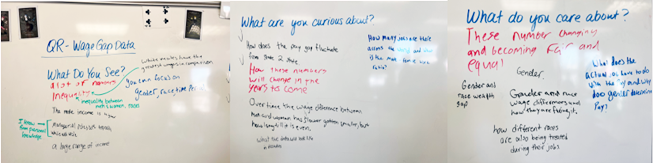
The students chose very different perspectives on the data, often in terms of their own race; for example,
I chose to explore the data set comparing the change in salary of women of different races… and I was drawn to it as a woman of color and was wondering why the difference in salary didn’t even out.
Another example was, “Since our table includes an Asian man and two White women, we chose those to be our y-axis.” The teacher used TI-Navigator to monitor student work (Figures 11 and 12), noting that some students were initially struggling with which variable to put on the horizontal axis. Others, such as Walkman, were creating unconventional graphs to try to represent the wage gap across occupations, and Michael had lost the time factor in his plot (Hispanic men’s income, Black men’s income). Because Navigator screens were visible to all students, it was common for a student to notice another student doing something interesting and try the same thing. For example, Jordan’s use of an exponential model for women’s income spurred other students to look at nonlinear models (Figure 12), and Katrin’s use of multiple y-variables for the same input (Figure 11) prompted others to ask her how she did this.
Figure 11
Screen Capture of Students’ Initial Work
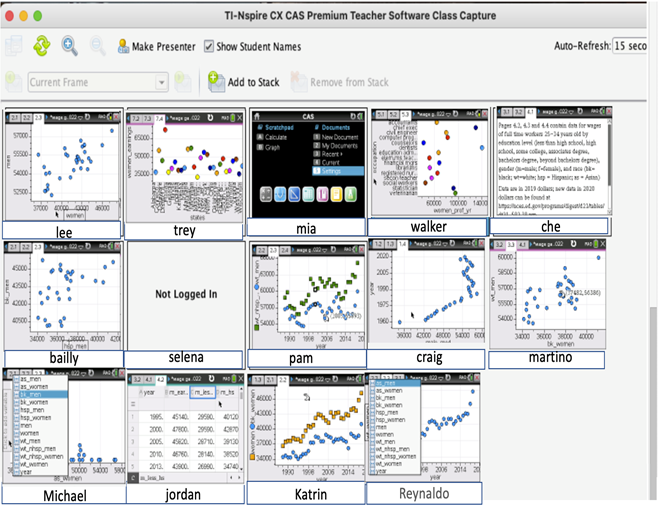
Figure 12
Screen Capture of Students’ Work During the Middle of Class

The actions of the teacher clearly demonstrated that she was not the authority in class. For example, students at first wanted more direction:
Student: “Do you want us to look at the mean wage gap by gender?”
Teacher: “Look at the data. See you what you see. I don’t want to influence this conversation. I want you to influence it.”
By encouraging the students to be curious about what they see and care about, the teacher was utilizing methods like the Notice and Wonder approach mentioned earlier. By actively encouraging students to look at the data in whatever way they saw fit, the students were being encouraged to use agency in the sense that they were the ones trying to figure out an aspect of the world, income gaps, through their own eyes. The screenshots show students’ struggles with the technology and with finding meaningful ways to approach the problem but also their perseverance, supporting their mathematical agency.
Follow Up
To explore the nature of the impact of the lesson on students’ thinking about mathematics and technology, 9 months after the lesson, we conducted follow-up interviews with four students. The students were selected by the teachers from those who were still in school and accessible in the new school year; two students (both seniors in Advanced Placement Statistics with the same teacher at the time of the interview) agreed to have individual videoconference meetings, and two others from the second teacher chose to provide written feedback to the interview questions. (Students from the third teacher were unavailable). In attendance for the online interviews were the two authors, the students being interviewed at that time, and their teacher. One of us asked the questions, but everyone was free to take part in the discussion. It was semistructured in the sense that we had questions to help guide the conversation, with the discussion building on the responses.
Before starting the first student interview, we asked the teacher what she remembered. She liked the real-time aspect of being able to see students’ thoughts as they were working on the Navigators and that students were selecting what they thought was most important from their perspective. She believed that this gave them more autonomy.
The interviews were conducted with students Paulo and Charles (not their real names), who, at the time of the lesson, were juniors in the Quantitative Reasoning course. We began by talking about what they remembered about the wage gap activity. For Paulo, researching racial equality based on data was a passion, so he and his group were excited by the activity. Charles remembered the disparities between men and women, which was what they chose to analyze, and that they had a choice in what they wanted to analyze (e.g., gender as opposed to ethnicity).
As the interview continued, Paulo told us that he remembered less from this activity and more about the class as a whole. Regardless, there was still some fruitful conversation, as the quantitative reasoning course was discussion-based (Notice and Wonder) and involved activities similar to the wage gap activity (Paulo remembered learning how to pay a mortgage in this class). They both enjoyed the real-world-based investigation. Being able to relate helped contextualize the math, but the discussions helped them understand more about why some aspects of the world are the way they are, and they appreciated having their voices heard. Paulo said that this felt more natural than just saying, “This is what it is,” also stating that this was “by far my favorite math class in high school.”
Similarly, Charles believed that seeing the math in everything helped put things into perspective (e.g., men are making more than women, and the numbers clearly show that). Charles thought that listening to the discussion and being able to talk with peers was helpful, especially getting ideas from others and being able to formulate and share his own ideas. As a result, these conversations helped contribute to Charles’ sense of agency since, through sharing ideas with others in terms of real-world contexts like the wage data, he was able to better understand a facet of his world and relate to how his peers perceived that world.
Paulo believed that the class did not use technology a lot because they were not using phones or computers; he mentioned that his Spanish class was technology-based because it was online. However, the teacher confirmed that they did use technology (e.g., NSpire) every day. It just was not what Paulo was thinking of when we asked about technology. Paulo specified that he did not consciously think about the Nspire as they were using it, although he now recognized that it enabled him to explore a lot of different aspects of the data.
Charles, on the other hand, stated that there was not a single lesson where they did not use technology, because they were always using the “internet or NSpire or something.” He said that they could “accessorize” and got the most out of their technology and resources. Charles also noted that NSpire helped because all the graphs and formulas were created with it. However, Charles thought that there was a learning curve to using NSpire because there is so much you can do with it. They are still learning things (more technical procedures in their statistics class now), and “that it’s still challenging because it’s math and you have to use your brain,” but it would have been much harder without the Nspires.
Regarding being able to see everyone’s work (with the technology), Paulo felt that it did not affect their own work, because they mostly thought through the problems alone initially. However, he could see the benefit of seeing different perspectives, particularly if one was stuck on a problem. He felt that the class rarely had to ask the teacher if they were right or wrong, because the collaborative nature meant that the students could engage each other to find solutions. This participatory nature of the class aligns with our discussion of figured worlds and how social activity is directly connected with the learning of mathematics. Charles said that seeing all their classmates’ work helped them think and made them feel like they were on the same page with their classmates. For him, it was a positive experience.
Paulo did not think that the wage gap activity alone shifted his perception of mathematics, but overall, the entire class throughout the year did. He was able to see how math is connected to various situations, and even though he might not use, for example, a regression line every day, he could learn how mathematics is connected to the world. Charles’ response tied directly to his sense of identity when he noted that, after this lesson, his perception of mathematics and what it meant to do mathematics changed and, in the context of the whole class, broadened his understanding of the usefulness of mathematics. This lesson was not the first time, but it was the first time they had been focusing entirely on graph work, and that really helped. He can read graphs a lot better now, and he belived his classmates would agree.
In addition to the two students interviewed, the written responses to the follow-up questions were from two students who had been in the second teacher’s class the prior year. Both students said they were already aware of the gender wage gap, with Mindy stating that the lesson provided helpful visuals and Elisa stating that she had not done much research on the topic. Regarding the mathematics they used, after she noted a classmate had discovered a moveable line, Mindy used her calculator to create one to capture the trend in the wages for men and women over time and then used the trace function to see when the lines would meet. Elisa’s group used points they thought would fall on a line of best fit for men and women and later found the regression function on their calculator to get a more accurate line.
Through discussions with classmates, Mindy learned that using a least-squares regression line instead of a moveable line is quicker but that the moveable line would be close to the least-squares line. Elisa thought that discussions allowed them to see different approaches that helped them better understand the math involved. Mindy liked being able to see everyone’s screen because by seeing everyone else’s thinking, they could adapt their own to get more efficient methods, with Elisa adding that it helped if they were confused. Elisa mentioned that seeing everyone’s screens did have a downside because they could see a solution path instead of creating their own, commenting that struggling and eventually solving a problem on your own can be very satisfying.
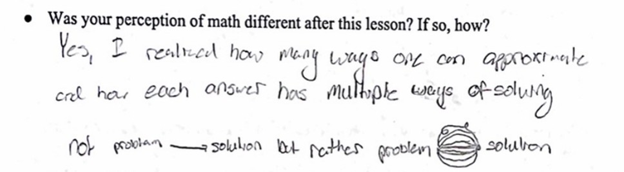
The last few questions related to their thoughts on mathematics. Before the lesson, Mindy felt that math was about solving problems for a variety of different subjects, as well as making predictions that can solve problems and help society, while Elisa felt that math was simply about getting answers. After the lesson, Mindy added that they realized math does not always have exact answers, while Elisa realized how many ways one can solve a problem or approximate an answer. Mindy and Elisa drew a visual (see Figure 13 below) to show that there is not a direct line from problem to solution but, rather, that there are many lines from problem to solution.
Figure 13
Student Explaining How a Problem-to-Solution Path Takes Place
Discussion
Earlier, we noted that we take a positive mathematical identity to mean that students feel empowered by mathematics and as doers of mathematics are comfortable doing the mathematics and with how others perceive them as doers of mathematics. They willingly participate in the work and discussions and appreciate why mathematics is important in their lives (Aguire et al., 2013; Berry & Larson, 2019; LaMar, 2020; NCTM, 2018). Our findings indicate that students readily explored the wages of different subgroups and could see a purpose in the mathematics and how it related to their own personal interests (deciding whether to explore gender or race as a factor in the wage gap; “I am a Hispanic male and…”).
In all the classrooms, teachers reported that students were interested, motivated, and involved in doing mathematics with everyone “on task” for the entire class. The student work and teacher descriptions of the lesson suggested that students shared, reasoned, argued, and revised their thinking together (Was the relationship linear or exponential? Can we use only the data from 1990), whether as a whole-class or in small groups, which gave them opportunities to construct positive mathematical identities of themselves and each other (Boaler & Staples, 2008; Hufferd-Ackles et al., 2004; Sengupta-Irving, 2014). In addition, LanSchool, TI-Navigator, and a document camera (conveyance technologies) allowed students to meaningfully participate in the mathematics personally by making their strategies visible. These devices also engaged students socially by providing a snapshot of a student’s work, such as using the movable line tool, elevating students when their ideas were identified as worth exploring (Berry & Larson, 2019).
Students seemed to be comfortable seeking out classmates who were doing something they found interesting, for example, graphing more than one dependent variable for a given independent variable (elevating another’s voice.) When students worried about being “correct” (LaMar, 2020), the teachers assured them the activity was about their perspectives and thinking, not focused on right answers (connecting to our discussion of noticing and wondering, which was more about promoting discussion than being right). As evidenced in the interviews, for at least some students, the experience enabled them to see the role of mathematics in helping them understand facets of the world in which they live.
As stated earlier, we see students demonstrating mathematical agency when they are in charge of their learning, make choices, engage in productive struggle, take risks to make their mathematical thinking visible, try different approaches, and are not afraid to change direction. They have a voice in the discussion and recognize that mathematics is a tool for understanding the world (Aguire, et.al.,2013; Boaler & Staples, 2008; LaMar, 2020; NCTM, 2018). The mathematical action technology empowered students by enabling them to draw on their own knowledge and resources and choose from many possible approaches to the task (e.g., analyzing the women to men ratio over time, creating regression lines and finding an intersection point, plotting the incomes for multiple races over time, or exploring residuals to find a better model).
Students took charge of their learning as they examined their work from multiple perspectives (e.g., estimating the point of intersection using trace, then using the NSolve functionality) and when they were able to self-correct, for example, plotting (men’s income, women’s income), recognizing this left out time as a variable, and easily switching the variables to have a plot over time. The screen captures (Figures 11 and 12) show students grappling with different graphical representations on their devices and provide opportunities for discussions (e.g., noting a new approach used by a peer and seeking the person out to learn how to do the same thing).
The teachers described incidents where students were able to quickly make and check conjectures (e.g., “It looks like men’s income is increasing at about $30 a year”) and noted that groups continued to explore even after they had arrived at a possible answer, looking for connections and other ways to think about the wage gap. Some students were motivated to do additional research to better understand the context and expressed interest in how data can be used for social change; some found women were far down the Forbes list of the wealthiest Americans (https://www.forbes.com/forbes-400/), and others used Pew Research to get more information about the wage gap amongst Asians. These students shared their findings with their peers in the days following the lesson.
The enacted lessons involved the concept of figured worlds, with classrooms as social settings where the students constructed joint meanings, assumed various roles, valued certain outcomes, and formed their own identity (Boaler & Greeno, 2000). The students did not just “do math” but shared, discussed, and argued in an environment that encouraged participation and dialogue amongst each other (i.e., a figured world). The teachers’ actions supported building students’ mathematical identity and agency by positioning them as mathematically competent (Aguirre et al., 2013). Verbally and by their actions, the teachers nurtured the notion that multiple stances and approaches could be valid; they sought out students with important ideas to share (Boaler & Staples, 2008) and encouraged students to talk with each other.
The teachers were not the source of authority in the classrooms (LaMar, 2020) but checked in periodically, asking students to “show me what you know,” and redirecting them, if necessary, “Show me how you got that.” Often in moving about the room, the teachers would ask a student who had figured out how to do something, such as set the graphing window to show the point of intersection, to explain their process to another student with the same question, giving students room to voice their thoughts.
An unexpected byproduct of the study is that the teachers involved noted changes in their own practice because of the lesson and ensuing discussions. One continued to look for other data to use with her students. Another wrote in an email,
I spent some time reflecting as students worked today. I approached it like we did with our Wage Gap activity. The screens were up on the board, and they could ask each other how to do things. And again… they blew me away. …It’s the VOICE that counts.
The third, after doing two other data-based lessons with her students, wrote,
I’m going to make this a recurring project for my regular stats this year. … I discussed this with my kids. They said they liked the idea, especially if I keep it open-ended with letting them explore THEIR variable of INTEREST.” [Capitalized words done by the teacher.]
Conclusion
In this paper, we described how the NCTM (2018) charge for mathematics teachers to include understanding and critiquing the world in the mathematics we teach and the AMTE (2022) position on using technology to advance equity and equitable teaching practices can work together. The enacted lessons suggest that context, social activity, and technology can support students’ mathematical learning and contribute to the development of student agency and identity in positive ways. Having the mathematics contextualized in the real world (NCTM, 2018), as opposed to being an abstract entity, seemed to help the students understand and care about the material, and technology helped bridge this gap by allowing them to grapple with the data. As students worked together, the conveyance and mathematical technologies made visible students’ ideas (as with the moveable line, different models students used) and diverse perspectives (as in analyzing the data based on race or challenging women’s income less than men’s) while providing access (everyone was highly involved) and opportunities (freedom to experiment, undo unproductive moves, and learning from each other). In addition, being able to discuss their thinking with their peers helped the students to develop community and mutual understanding.
These findings are aligned with the research mentioned at the beginning of this paper, suggesting students are motivated to learn and have opportunities to build their mathematical identities when they engage in tasks relevant to who they are and that they see as useful and worthwhile and when they have options for choice in their work (Anderson, 2016; Horn, 2017; Neumann et al., 2013; Matthews, 2017). The students verbalized (those interviewed and others to their teachers during and after the lesson) that they enjoyed discussing mathematics in a contextualized and technological way and took something valuable from the lesson.
Because the technology supported equitable teaching, which then built student identity, agency, and competence, classrooms became communities of learners. Encouraging students to notice and wonder and creating a classroom environment, a figured world, where student voice drives the work led to student engagement and involvement in the mathematics. In the words of one of the teachers, “The fact that they had technology to test the reasonableness of their thinking builds their confidence in their own voice.”
The study was small and could only suggest what might be possible. More work needs to be done on how to develop students’ ability to “tell the story” in their results using mathematics to unpack the context. The students in the classes and those interviewed were not randomly selected. A major limitation is that the teachers for these activities were experienced mathematics teachers who were comfortable with the technology and with giving their students the freedom to take charge. How to support teachers without such a background in implementing such a lesson is not clear and is a matter for further study. In addition, further research would be necessary to explore nuances, such as features of the technology, the classroom, and the nature of tasks that support the development of student agency and identity. Despite the limitations in the study, we found that using technology with real-world context can help support students’ sense of agency and identity and would encourage teachers and researchers to build on the positive results we found.
Author Note
Gail Burrill, http://orcid.org/0000-0001-9629-4100
References
Aguirre, J., Mayfield-Ingram, K., & Martin, D. (2013). The impact of identity in K-8 mathematics: Rethinking equity-based practices. National Council of Teachers of Mathematics.
Anderson, M. (2016). Learning to choose, choosing to learn. Association for Supervision and Curriculum Development.
Arnold, P., & Franklin, C. (2021). What makes a good statistical question? Journal of Statistics and Data Science Education, 29(1), 122-130. https://doi.org/10.1080/26939169.2021.1877582
Association of Mathematics Teacher Educators. (2022). Position of the Association of Mathematics Teacher Educators on Technology. https://amte.net/sites/amte.net/files/AMTE%20Technology%20Statement%20Oct%202022_0.pdf
Berry III, R., & Larson, M. (2019). The need to catalyze change in high school mathematics. Phi Delta Kappan, 100(6), 39-44.
Boaler, J. (2002). The development of disciplinary relationships: Knowledge, practice and identity in mathematics classrooms. For the Learning of Mathematics. 22(1), 42-47. https://www.jstor.org/stable/40248383
Boaler, J., & Greeno, J. (2000). Identity, agency, and knowing in mathematics world. In J. Boaler (Ed.), Multiple perspectives on mathematics teaching and learning (pp. 171-186). Ablex Publishing
Boaler, J., & Staples, M. (2008). Creating mathematical futures through an equitable teaching approach: The case of Railside School. Teachers College Record, 110(3), 608-645. https://doi.org/10.1177/016146810811000302
Boels, L., (2023). Histograms: An educational eye [Doctoral dissertation,
Freudenthal University]. International Association for Statistical Education.
https://iase-web.org/Publications.php?p=Dissertations
Bransford, J., Brown, A., & Cocking, R. (2000). How people learn: Brain, mind, experience, and school. National Academy Press.
Burrill, G., & Dickson, A. (2023). Statistical literacy and the role of communication. In E. Jones (Ed.), Fostering learning of statistics and data science: Proceedings of the International Association for Statistical Education 2023 Satellite Conference, Toronto, Canada
Burrill, G., Funderburk, J., Byer, B., & Gorsuch, R. (2023). Using technology to explore the wage gap. Mathematics Teacher: Learning and Teaching Mathematics PreK-12. 116(5), 378-386. https://doi.org/10.5951/MTLT.2022.0348
Campbell, T. G., & Yeo, S. (2023). Student noticing of collaborative practices: Exploring how college students notice during small group interactions in math. Educational Studies in Mathematics, 113(3), 405-423.
Darragh, L. (2016). Identity research in mathematics education. Educational Studies in Mathematics, 93(1), 19–33. https://doi.org/10.1007/s10649-016-9696-5.
Delavan, M. G., & Matranga, A. (2020). Culturally and linguistically responsive noticing and wondering: An equity-inducing yet accessible teaching practice, Journal of Multicultural Affairs, 5(1), Article 5.
Dick, T., & Hollebrands, K. (2011). Focus in high school mathematics: Technology to support reasoning and sense making (pp. xi-xvii). National Council of Teachers of Mathematics.
Engel, J. (2017). Statistical literacy for active citizenship: A call for data science education. Statistics Education Research Journal, 16(1),44-49. https://doi.org/10.52041/serj.v16i1.213
Goodwin, A. L. (1994). Making the transition from self to other: What do preservice teachers really think about multicultural education? Journal of Teacher Education, 45(2), 119–131.
Goodman, M., Sands, A., & Coley, R. (2015). America’s skills challenge: Millennials and the future. Educational Testing Service.
Gordon, K. H. (1991). Improving practice through illuminative evaluation. Social Service Review, 65(3), 365–378. http://www.jstor.org/stable/30012405
Graven, M., & Heyd-Metzuyanim, E. (2019). Mathematics identity research: The state of the art and future directions. ZDM Mathematics Education, 51(3), 361-377. https://doi.org/10.1007/s11858-019-01050-y
Heritage, M. (2007). Formative assessment: What do teachers need to know and do? Phi Delta Kappan, 89(2), 140–146.
Hidayat, R., Zulnaidi, H., & Syed, Z. (2018). Roles of metacognition and achievement goals in mathematical modeling competency: A structural equation modeling analysis. PLOS ONE, 13(11). https://doi.org/10.1371/journal.pone.0206211
Hohensee, C. (2016). Student noticing in classroom settings: A process underlying influences on prior ways of reasoning. The Journal of Mathematical Behavior, 42, 69–91.
Horn, I. 2017. Motivated: Designing classrooms where students want to join in. Heinemann.
Hufferd-Ackles, K., Fuson, K., & Sherin, M. (2004). Describing levels and components of a math-talk learning community. Journal for Research in Mathematics Education, 35(2), 81-116. https://doi.org/10.2307/30034933
International Data Science School Project. (2019). Curriculum frameworks for introductory data science. http://idssp.org/files/IDSSP_Frameworks_1.0.pdf.
Jacobs, V. R., et al. (2010). Professional noticing of children’s mathematical thinking. Journal for Research in Mathematics Education, 41(2), 169–202.
Klein, V., Matranga, A., & Silverman, J. (2019). Using the Math Forum’s notice & wonder strategy to support teachers to see students as sense-makers [Paper presentation]. Association of Mathematics Teacher Educators Conference, Orlando, FL, United States.
LaMar, T. (2020). Relationships with mathematics: The importance of agency and authority. In A. Sacristán, J. Cortés-Zavala, & P. Ruiz-Arias, P. (Eds.), Mathematics education across cultures: Proceedings of the 42nd meeting of the North American Chapter of the International Group for the Psychology of Mathematics Education (pp. 2097-2104). https:/doi.org/10.51272/pmena.42.2020
LaMar, T., & Boaler, J. (2021). The importance and emergence of K-12 data science. Phi Delta Kappan, 103(1), 49-53. https://doi.org/10.1177/00317217211043627
Langer-Osuna, J., & Esmonde, I. (2017). Identity in research on mathematics education. In J. Cai (Ed.), Compendium for research in mathematics education (pp. 637-648). National Council of Teachers of Mathematics.
Lee, H., Mojica, G., Thrasher, E., & Baumgartner, P. (2022). Investigating data like a data scientist: Key practices and processes. Statistics Education Research Journal, 21(2). https://doi.org/10.52041/serj.v21i2.41
Lobato, J., Rhodehamel, B., & Hohensee, C. (2012). “Noticing” as an alternative transfer of learning process. The Journal of the Learning Sciences. 21(3). 433-482. https://doi.org/10.1080/10508406.2012.682189
Lobato. J., Hohensee, C., & Rhodehamel, B. (2013). Students’ mathematical noticing
Journal for Research in Mathematics Education, 44(5), 809-850.
Luttenberger, S., Hackl-Wimmer, S., & Paechter, M. (2018). Spotlight on math anxiety. Psychology Research and Behavior Management, 11. 311-322. https://doi.org/10.2147/PRBM.S141421
Matthews, J. S. (2018). When am I ever going to use this in the real world? Cognitive flexibility and urban adolescents’ negotiation of the value of mathematics. Journal of Educational Psychology, 110(5), 726–746. https://doi.org/10.1037/edu0000242
Maynard, B., Kjellstrand, E., & Thompson, A. (2014). Effects of check and connect on attendance, behavior, and academics: A randomized effectiveness trial. Research on Social Work Practice, 24(3), 296-309.
Modeling median income. Math Nspired. (2020). Texas Instruments Education. https://education.ti.com/en/timathnspired/us/mathematical-modeling/prediction
Moses R., & Cobb, C. (2001). Radical equations: Civil rights from Mississippi to the Algebra Project. Beacon Press.
National Council of Teachers of Mathematics. (2018). Catalyzing change in high school mathematics: Initiating critical conversations. Author.
Neumann, D., Hood, M., & Neumann, M. (2013). Using real-life data when teaching statistics: Student perceptions of this strategy in an introductory statistics course. Statistics Education Research Journal, 12(2), 59-70. https://doi.org/10.52041/serj.v12i2.304
Nicol, D., Thomson, A., & Breslin, C. (2014). Rethinking feedback practices in higher education: A peer review perspective. Assessment and Evaluation in Higher Education, 39(1), 102–122.
Parke, C. (2017). Reasoning and communicating in the language of statistics. Journal of Statistics Education, 16(1). https://doi.org/10.1080/10691898.2008.11889555
Parlett, M., & Hamilton, D. (1976). Evaluation as a new approach to the study of innovatory programs. In G. Glass (Ed.), Evaluation studies annual review, pp. 140-57. Sage Publications.
Popkewitz, T. (1984). Paradigm and ideology in educational research. Falmer Press.
Rumack, A., & Huinker, D. (2019). Capturing mathematical curiosity with notice and wonder. Mathematics Teaching in the Middle School, 24(7), 394-399. https://doi.org/10.5951/mathteacmiddscho.24.7.0400
Sacristan, A. (2021). Digital technologies, cultures, and mathematics education. In J. Wang (Ed.), Proceedings of the Fourteenth International Congress on Mathematical Education, Shanghai, China, Vol 2. Invited Lectures (pp. 521-540)
Sengupta-Irving, T. (2014). Affinity through mathematical activity: Cultivating democratic learning communities. Journal of Urban Mathematics Education, 7(2), 31-54. https://doi.org/10.21423/jume-v7i2a208
Speranzo, L., & Tillema, E. (2019). Designing for voice and agency. Mathematics Teaching in the Middle School, 24(7), 400-405. https://doi.org/10.5951/mathteacmiddscho.24.7.0449
Stinson, D., & Wager, A. (Eds.). (2012). Teaching mathematics for social justice: Conversations with educators. National Council of Teachers of Mathematics
Su, Francis. (11/19/2021). Finite disappointment: Infinite hope. Iris M. Carl Address. National Council of Teachers of Mathematics Virtual Conference.
Turner, E., Dominguez, H., Maldonado, L., & Empson, S. (2013). English learners’ participation in mathematical discussion: Shifting positionings and dynamic identities. Journal for Research in Mathematics Education, 44(1), 199-234. https://doi.org/10.5951/jresematheduc.44.1.0199
van Es, E., & Sherin, M. (2008). Mathematics teachers’ “learning to notice” in the context of a video club. Teaching and Teacher Education, 24(2), 244–276.
van Es, E., Hand, V., Agarwal, P., & Sandoval, C. (2022). Multidimensional noticing for equity: Theorizing mathematics teachers’ systems of noticing to disrupt inequities. Journal for Research in Mathematics Education, 53(2), 114–132. https://doi.org/10.5951/jresematheduc-2019-0018
Weiland, T. (2017). Problematizing statistical literacy: An intersection of critical and statistical literacies. Educational Studies in Mathematics, 96(1), 33–47. https://doi.org/10.1007/S10649-017-9764-5
