Data are central to educational improvement in the United States. At a classroom level, data support professional development. Teachers need meaningful data about their teaching to support ongoing learning and improvement to practice. In particular, given the ongoing and urgent calls to improve racial and gender equity in mathematics education (e.g., Martin, 2019), teachers need actionable data identifying and describing racial and gender inequities in their classrooms. The study described in this article focused on data generated by the EQUIP observation tool (Reinholz & Shah, 2018), which was designed for precisely this purpose.
This study drew upon data from a yearlong professional development effort with five middle school mathematics teachers (Herbel-Eisenmann & Shah, 2019). The professional development was organized around iterative cycles of instructional improvement, with EQUIP analytics being used to structure each cycle of reflection and revision of teaching practices. This article focuses on instructors’ sensemaking as they processed the analytics. This work was driven by the following research question: What logics did teachers draw upon to make sense of racial and gender inequities in student participation, as presented by EQUIP analytics?
This work makes multiple contributions. First, although data are routinely used in professional development (e.g., Horn et al., 2015), little research has explicated associated teacher logics, which we define as the explanations teachers use to rationalize the data. Thus, the present work pushes the field forward by focusing deeply on sensemaking around particular analytics, a level of granularity required for educational designers to create more effective visualizations.
Second, most observation tools provide data only at the level of a classroom. That is, such tools cannot speak to the experiences of a particular group of students, such as Black girls. In this way, the EQUIP analytics — which are focused on social marker groups — provide a window into understanding how teachers reason about equity.
Theoretical Background
Participatory Inequities in Mathematics Classrooms
This study focused on participatory equity, which concerns the fair distribution of participation and opportunities to participate in the classroom (Shah & Lewis, 2019). Student participation is consequential to equity for multiple reasons. First, research shows that participation is an important mechanism for learning content (Banes et al., 2018), for instance, because learners consolidate their learning when they explain their thinking (Chi et al., 1994).
Second, when students make their ideas public, they can receive feedback from peers and the instructor, which is also important for learning (Reinholz, 2016). Third, identity development is closely linked to participation (Nasir, 2002), and identifying with a discipline creates in students a sense of belonging that is essential for persistence (Lewis et al., 2016).
Simultaneously, research shows that women and racially minoritized students tend to receive disproportionately fewer and lower quality participation opportunities in mathematics classrooms (e.g., Ernest et al., 2019; McAfee, 2014). These inequities arise because classrooms are not immune to oppressive structures such as patriarchy and white supremacy. For instance, young girls face stereotype threat, teachers’ biased impressions of their competence, and the transference of gendered mathematics anxiety from their teachers (Lubienski & Ganley, 2017). Similarly, racially minoritized students face hostile racial discourses, microaggressions, and low teacher expectations (e.g., Larnell et al., 2014).
These systems of oppression also work together, when students are marginalized along multiple strands of their identities (Crenshaw, 1990). All of these phenomena play out in ways that inhibit women and racially minoritized students from participating in mathematics classroom discourse.
Given that these oppressive structures are systemic in society, there is clearly a limit to the work any individual teacher can do to dismantle them in their classroom. Nonetheless, one plausible entry point into grappling with these larger systems is through addressing implicit biases.
Implicit biases impact one’s thoughts, beliefs, and actions in subtle, unconscious ways that are not visible to an individual (Greenwald & Banaji, 1995). Implicit biases in mathematics are driven by problematic stereotypes. They may include “Asians are good at math” (Shah, 2017, p. 1) or the “white male math myth” (Stinson, 2008, p. 989), which create a “popular image of mathematics” as “difficult, cold, abstract, ultra-rational, important and largely masculine” (Ernest, 1992, p. 53). Even teachers who do not endorse such stereotypes are impacted by them subconsciously, for instance, in the expectations they have toward girls (Robinson-Cimpian et al., 2014), or whether they make students of color invisible in their classrooms (Shah, Herbel-Eisenmann, et al., 2020).
These biases also play out between students, for example, when they engage in sexist microaggressions during small group work time (Ernest et al., 2019). Addressing implicit biases first requires that teachers be aware of the impacts of implicit bias within their classrooms. In this way, data can play an important role in illuminating what are otherwise invisible phenomena, as we now elaborate.
Data for Instructional Improvement
The use of data to improve instruction is ubiquitous (Datnow & Hubbard, 2016). However, the majority of these data come from standardized tests (Farrell & Marsh, 2016; Van Gasse et al., 2016). Unfortunately, research suggests that test-based, data-driven accountability initiatives – even those that are ostensibly framed about improving equity – can actually result in the exacerbation of inequity at a classroom level, as they frame students from a deficit perspective and constrain teacher agency (Braaten et al., 2017). The underlying logic of test-based accountability focuses on current inequities in performance, rather than the historical, structural antecedents that actually led to such inequities (Garner et al., 2017).
Given the limitations of focusing on student test scores, researchers argue, instead, the need for data attending to the quality students’ classroom experiences (Braaten et al., 2017). This need has spurred the development of the equity analytics paradigm, which focuses on the ways data describing patterns of student participation can be used to promote instructional improvement and lead to deeper conversations about dismantling systems of injustice (Reinholz & Shah, 2018).
Still, a key consideration is the type of teacher sensemaking that takes place around data (Schildkamp, 2019); that is, how do teachers analyze and interpret data, and how does this process relate to their instructional improvement goals and practices? Research shows that the particular teacher logics utilized are central to the efficacy of the sensemaking process (Horn et al., 2015). Moreover, sensemaking is dependent on the particular context and approach. Thus, we introduced a conceptual model for understanding teacher sensemaking around racial and gender inequity in student participation.
Conceptual Frame
Figure 1 illustrates a conceptual model for ways teachers make sense of student participation data. Our model breaks the larger sensemaking process into four components. The inner circle focuses on teachers’ moment-to-moment sensemaking through teacher logics, which are the explanations teachers use to rationalize the data, and mediating artifacts, which are the particular features of the data visualizations that influence sensemaking. The outer circle focuses on comparatively more stable constructs, which teachers may draw upon as they generate explanations in the moment. These constructs are ideologies, which are broader ways of thinking (e.g., about race, gender, and teaching) and practices, a teacher’s concrete teaching techniques.
Figure 1 Conceptual Model for Teacher Sensemaking of Student Participation Data
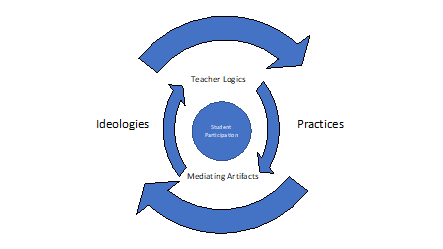
Inner Circle: Teacher Logics and Mediating Artifacts
The inner circle focuses on the moment-to-moment sensemaking that occurs when teachers engage with data representing student participation patterns. This sensemaking involves an interplay between teacher logics and mediating artifacts. Given the complex, multidimensional nature of student participation patterns, any given pattern typically has multiple plausible explanations (i.e., logics).
For instance, a teacher might attribute a student’s lack of participation to characteristics of the student (e.g., they are shy), the student’s circumstances (e.g., they do not have homework support at home), their race (e.g., my Latino students are struggling), or other situational factors (e.g., the student just broke up with their partner). When teachers fixate on immutable characteristics of students, rather than situational factors, they may miss their own role in empowering or marginalizing their students.
While teachers often have a set of preferred explanations for why students do or do not participate, the particular explanations that teachers draw on are influenced by mediating artifacts, or the particular data representations of student participation. For instance, if participation is not disaggregated by student social markers, racialized and gendered phenomena will necessarily be obscured. Types of representations also matter. For example, a pie chart could cue the zero-sum thinking (who gets the biggest piece of the pie), while bar charts of individual students would draw attention to particular individuals who are left out. Although research has found that the nature of data representations matters (e.g., Saket et al., 2019; Szafir, 2018), little is known about the role of particular representations in teacher education.
Outer Circles: Ideologies and Practices
Ideologies are interpretative frameworks consisting of various cultural representations, which are used to make sense of the social world (Hall, 1985). For example, in education, a student’s difficulties in learning mathematics content may be explained by describing the student as a “slow learner” (Horn, 2007, p. 50) or “learning disabled” (McDermott, 1993, p. 271). They might also be described by false racial narratives (e.g., “Latino families don’t care about their children’s education”; Gonzalez & Ayala-Alcantar, 2008, p. 139). Often, these ideologies represent negative generalizations about particular groups, but they need not be negative.
Ideologies influence how a teacher interprets classroom situations. For instance, if a teacher believes a group of students is lazy, they might initiate punitive measures. In contrast, a teacher who recognizes systemic barriers would instead work to remove those barriers and provide appropriate support. Ideologies also indirectly impact teaching through implicit biases, for instance, impacting who a teacher calls on and how (Shah et al., 2020).
Teaching practices can also impact ideologies. For example, if a mathematics teacher asks only low-level questions to Black students, thereby denying them meaningful participation opportunities, the teacher will be unlikely to see the underlying brilliance of Black students (cf. Bullock et al., 2012). Thus, oppressive ideologies become a self-fulfilling prophecy.
Teachers may also actively disrupt racism, for instance, through assigning competence (Cohen & Lotan, 1997), which can shift classroom hierarchies. Shifting these hierarchies results in new patterns of participation. In witnessing the abilities of students as they participate, teachers can experience a counternarrative to negative ideologies about mathematical ability.
Method
Context
Research took place at Northstar Middle School (a pseudonym), a suburban Midwest U.S. school. Teachers at Northstar had a longstanding (5-year) collaboration that involved action research with researchers at a local university. The present work was motivated in part by a growing Latinx student population in the district, which had shifted classroom demographics. While prior work focused on classroom discourse, this study was the first time that teachers had access to data that described gendered and racialized patterns in their classes, which were provided by the EQUIP classroom observation tool. All names in this research report are pseudonyms.
Participants and Design
Five mathematics teachers participated in the study (all white; four women and one man). These teachers were chosen because they had multiple years of experience engaging in action research and also considerable teaching experience across the board; all had been teaching for 10 to 30 years. Given these characteristics, the teachers were experienced reflecting on their teaching practice, but they had never done so with EQUIP data. These factors made them ideal participants in a study focused specifically on EQUIP data. For this study, each teacher selected one focal class for action research with EQUIP.
The study took place over a single academic year. Initially, the research team met with participants and shared a presentation on implicit bias, the EQUIP tool, and the differences between equity and equality. The work over the year to come was then organized by iterative research cycles of video observation, coding, reflection, and changing practices.
Each research cycle lasted roughly 6 weeks, with each teacher videotaped approximately three to four times each per cycle (with a total of four cycles). These videos were coded with EQUIP, so that data analytics could be provided to the teachers. To end each cycle, we held a half-day reflection meeting, where teachers watched videos of their teaching, discussed their data with colleagues in larger groups, and debriefed (~30 minutes) with a member of the research team. The debriefs focused on EQUIP analytics from that cycle of observations. Debriefs aimed to help teachers process the data and develop concrete action plans to improve equity in their classes.
Data Sources
The analysis reported here focused on the 30-minute teacher debriefs from the four cycles of reflection with EQUIP data, which followed a semistructured protocol (guiding teachers to look at their data). Our analysis also drew upon pre- and postinterviews that were conducted with each teacher to provide context for understanding the debriefs. All of these data were audio recorded and transcribed.
The preinterview focused on background information, such as childhood experiences around race and gender, professional trajectory, and pedagogical approach. The postinterviews allowed for reflection on lessons learned throughout the year. Finally, we used actual EQUIP analytics as a secondary data source, when necessary, to understand what the teachers and researchers were discussing in the debriefs.
EQUIP
The EQUIP classroom observation tool was used to provide teachers with data describing disaggregated patterns of student participation (Reinholz & Shah, 2018). In prior work, EQUIP has been used both as a research tool for documenting inequities in classroom participation (e.g., Ernest et al., 2019) and as a professional development tool to provide real data to instructors that they can use to improve their teaching (e.g., Reinholz, Bradfield et al., 2019; Reinholz, Stone-Johnstone et al., 2019; Reinholz et al., 2020; Shah et al., 2020). Building on this body of work, the focus of the analysis reported in this article was different and turned to the data analytics in the tool itself and how they supported teacher sensemaking.
Conceptually, EQUIP describes how classroom participation is distributed; it cannot describe how participation should be distributed. Rather, the purpose of EQUIP is to provide analytics — without judgment — that teachers and coaches can use together to support instructional improvement.
In general, the EQUIP developers view equality as a baseline toward equity (Secada, 1989), recognizing that minoritized students typically get less than an equal share of opportunities to participate. Thus, if EQUIP analytics indicated that a minoritized population was getting less than an equal share of participation opportunities, it would be viewed as a potential area for teacher intervention.
In EQUIP, the unit of analysis is a sequence of talk; a sequence starts when a new student speaks and ends when another student speaks. With this definition, any length of interaction between the instructor and a single student is considered one sequence. On the other hand, if two students are having a conversation, then a new sequence begins each time a student speaks.
The particular design decision within EQUIP to start a new contribution each time a new student speaks was two-fold:
- Because each coded contribution corresponds to a single student, demographic information can be attached to individual students, which can then be aggregated in the analysis process, and
- This decision leaves little doubt where to start a new sequence, which supports a high level of interrater reliability, even with coders who are relatively new to the process.
As a result of this decision, in a classroom where there is more student-to-student talk, there will be a relatively higher number of sequences coded.
To code with EQUIP, an observer (a) chooses discourse dimensions (what will be coded), (b) chooses demographic categories (race and gender in this study), and (c) creates a student roster that includes demographic information. The EQUIP observer is typically a coach or researcher, but in some prior studies teachers have coded videos of their own teaching (Shah et al., 2020).
In this study, all teachers used the dimensions of solicitation type, student talk type, andstudent talk length (see Table 1), as well as individualized custom dimensions. These dimensions allowed the teachers to go beyond quantity of participation also to understand the quality of opportunities afforded to different students (cf. Braaten & Windschitl, 2011).
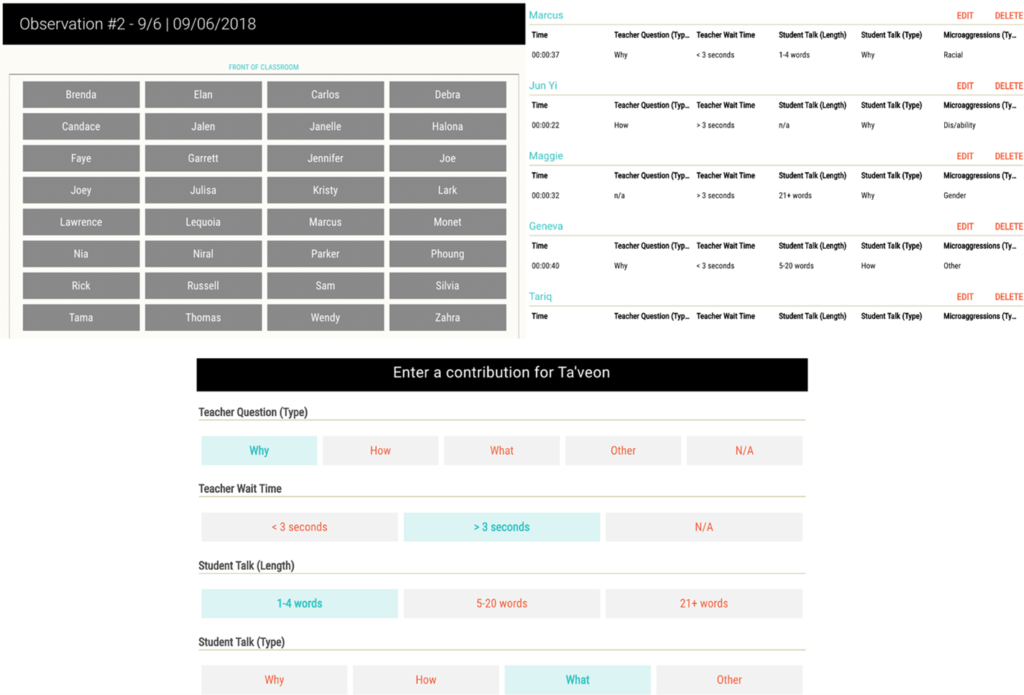
We used the EQUIP app (https://www.equip.ninja) to streamline coding. EQUIP is a free, open-source tool that supports researchers using the EQUIP protocol. The app can be used either in real time or as a platform for analyzing previously recorded classroom videos (which was the case in this study). EQUIP does not record a teacher’s classroom and efficiently allows for coding without transcripts of classroom video. The EQUIP app guides a user to set up a classroom seating chart, which is also used as the interface for coding (see Figure 2). When a user clicks on a student’s desk, they are given the option to code that student’s participation, and EQUIP keeps a running log of coded participation, which provides the raw data for analytics that can be generated.
Table 1 Codes Used to Capture the Quality of Student Discourse
| Subcode | Definition |
|---|---|
| Solicitation Type | |
| Why | Instructor asks student to explain/justify their reasoning |
| How | Instructor asks for a student’s solution method |
| What | Instructor asks a student to read part of a problem, recall a fact, or give a numerical/verbal answer |
| Other | Instructor asks a general question (e.g., “What did you think?”) |
| N/A | Instructor does not ask the student a question |
| Student Talk Type | |
| Why | Student explains/justifies their reasoning |
| How | Student describes solution method |
| What | Student reads part of the problem, recalls a fact, or gives a numerical/verbal answer to a problem |
| Other | Student asks a question or says something nonmathematical |
| Student Talk Length | |
| 21+ words | 21+ words typically correspond to multiple sentences |
| 5-20 words | 5-20 words typically correspond to one sentence |
| 1-4 words | 1-4 words corresponds to a short statement (often a single-word answer) |
To generate analytics, EQUIP combines the coded sequences corresponding to individual students with demographic information, so that analytics can be generated about specific groups of students (e.g., Black boys). One such analytic is an equity ratio, which compares the actual distribution of talk-based participation to the expected distribution, using classroom demographics as a baseline. For instance, if a class is 60% women, but they receive only 30% of the questions, the ratio would be one half, indicating a disproportionately low level of participation. A ratio of 1 indicates that a group is participating proportionally to its demographic representation in the class, and a ratio >1 indicates disproportionately high participation.
Figure 2 Screenshots From the Coding Interface in the EQUIP Web App
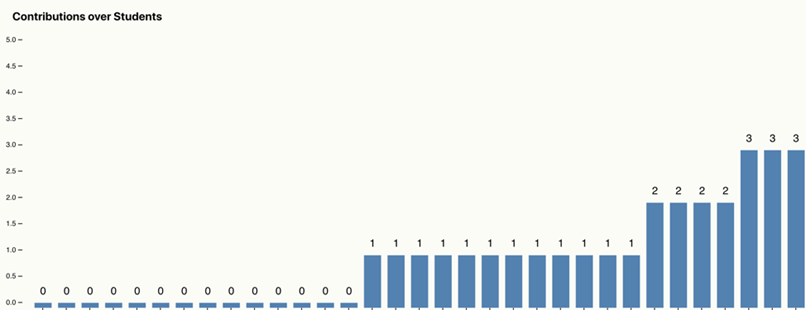
The EQUIP web app can also automatically generate data visualizations corresponding to the EQUIP observation protocol. In this analysis, we focused on two types of data visualizations that can be generated within EQUIP. Figure 3 is the equity ratio graph, which describes the breakdown of a particular discourse dimension (in this case, teacher question) according to a demographic category (in this case, gender). Figure 4 shows the individual student graph, which shows how much each individual spoke in class. These visualizations provided the basis for professional development with teachers in the study.
Figure 3 Equity Ratio Graph for Gender
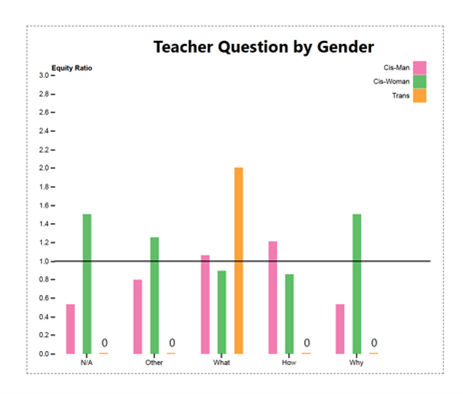
Figure 4 Individual Student Graphs
Students may engage in a variety of meaningful, but nonverbal, forms of participation (e.g., see O’Connor et al., 2017; Radford, 2003), which are not captured. Because no tool can capture all meaningful aspects of classroom activity, EQUIP focuses on verbal participation, given its important role in the learning process (Banes et al., 2018). A tool designed to shed light on these forms of participation would provide different insights for teachers to improve equity in their classrooms.
Analytic Methods
The goal of our analysis was to understand the logics that teachers drew upon when interpreting racial and gender inequities in student participation. Thus, we aimed to develop grounded theories about one of the four components of our conceptual model of teacher sensemaking. Within each teacher logic, we made connections to mediating artifacts, ideologies, and teaching practices (shown in italics in the Findings section). The purpose of connecting to these other constructs was to illustrate how logics were connected to other aspects of sensemaking, but developing deeper theories of the other constructs was beyond the present analysis.
Data analysis followed a process of qualitative thematic analysis (Boyatzis, 1998) and constant comparison (Krathwohl, 1998). Such an analytic approach was appropriate because there were no a priori coding schemes that characterized the different logics teachers drew upon. By applying grounded theory to the transcripts of teacher sensemaking, we created an emergent thematic framework of how teachers made sense of patterns of racial and gender equity data.
The first step of analysis was open coding teacher debriefs. Open coding aimed to identify all instances of teachers interacting with EQUIP analytics or describing insights they gained from the analytics. At the end of this step, the first author had generated annotated transcripts of teacher debrief conversations that highlighted the segments of interest. The second step was to generate initial categories to group together the codes that were generated in the first step. During this step, the first author generated seven initial categories.
The third step involved a thematic analysis to determine and summarize the predominant categories. At this point in the process, both authors met to discuss the categories. After this discussion, the categories were refined to the six predominant categories described in the findings section. Step 4 involved the first author analyzing the data corpus again to look for evidence in favor of and against the preliminary themes. These themes were categorized by the logics that teachers used to make sense of the data, with connection to features of the data visualizations.
Findings
We found that teachers employed a variety of logics to make sense of the data visualizations provided by EQUIP. Table 2 organizes six predominant logics according to reasoning about aspects of teaching related to social marker categories or describing individuals.
Table 2 Summary of Teacher Logics
| Teacher Logic | Example |
|---|---|
| Social Marker Groups | |
| Equality | “I’d like to see all of the bars right at the one [the equity ratio = 1 line].” |
| Balance | “I need for girls and boys to be balanced in their participation.” |
| Reparation | “I like to see that my Latinx students [a minoritized group] are participating above 1.” |
| Individuals | |
| Coverage | “I want to make sure that all of my students are participating.” |
| Focus | “I notice that Dante had a low level of participation.” |
| Redistribution | “Andy is dominating the class discussions, and I need him to talk less so other students can participate.” |
Social Marker Groups
The primary goal of the EQUIP analytics was to draw attention to different social marker groups, which was achieved through equity ratio bar graphs. The “equity ratio = 1” line was a salient feature for teachers. Even though the we clearly stated, “Equity is not equality,” teachers often talked about this line as though it was the “correct” or “target” value for equity. This response mediated reasoning about equity in a variety of different ways.
Equity as Equality
A common logic expressed by teachers was that equity required their students to have equal participation during class sessions. This logic was mediated by the salience of the “equity ratio = 1” line. We found evidence that three of five teachers used the line as a target value.
For instance, Ms. Davis (Round 1) stated, “If [participation] were perfectly equitable, the idea is that these bars would both be at the 1. What is expected is what happens. Right?” Here, Ms. Davis referred to all of the bars falling exactly on the equity ratio line, or equal for all students. Ms. Davis made this statement even though the interviewer clearly stated, “Equal isn’t necessarily equitable,” only a few moments earlier. We infer that the salience of the equity ratio line cued Ms. Davis to draw upon an equity as equality logic.
Under some circumstances, the equity as equality logic can result in productive changes to practice. For instance, during Round 3, Ms. Davis noticed that she was “not posing as many questions” to girls in the class. She noted her strategy of using “popsicle sticks” to randomize participation did not allow her to be “intentional” about increasing participation for girls. She discussed an alternative strategy of letting “the kids think I’m drawing sticks” but then intentionally selecting a girl. In this way, the presence of a minoritized group (in this case, girls) receiving less than a fair share of participation opportunities meant that an equity as equality logic could result in changes in practice that would support greater equity.
We also found evidence, however, that the equity is equality logic can work against equity. Like Ms. Davis, Ms. Stone described that “in theory, [the bars] should all be right at the line” (Round 3). Accordingly, in Round 2, Ms. Stone stated that “I need the African American bar to come down,” because it was above the equity ratio line. Thus, the teacher concluded she needed to provide fewer participation opportunities to Black students. In this case, the analytics actually worked against the goal of providing more opportunities for minoritized students.
The pitfalls of an equity as equality ideology were demonstrated by Ms. Smith (Round 2), when she noticed that girls in her class were participating much more than boys and said,
Is that necessarily a bad thing that my female students are speaking so much, and do I want to shut them down? No, I don’t want to shut them down. At the same time, I wanna encourage the boys to talk, and I wanna give them opportunities. The problem was, I’m not giving them opportunities. I was letting the girls run the show because they just were.
What Ms. Smith noticed was that the participation for girls in her class was well above the “equity ratio = 1” line, and she saw this as a deviation from the ideal. While Ms. Smith verbalized that she did not want to “shut down” the girls, there was an unarticulated tension. If Ms. Smith increased the participation level of boys in her class, it would necessarily come at the expense of girls participating, given the zero-sum nature of participation.
Equity as Balance
Related to the idea of equity as equality was the logicof equity as balance. We found evidence that all five instructors invoked this logic. Sometimes, these invocations were mediated by the visual representations, and other times it came up more generally in the absence of a particular representation.
For example, Ms. Stone (Final Debrief) expressed that she was “concerned that I do see some things [the types of questions] that are not balanced [between boys and girls].” Here, Ms. Stone expressed a desire for participation to not be too far away from a balanced equilibrium but did not articulate that the participation levels should be exactly equal.
In contrast to equity as equality, the logic of balance was more flexible. For example, Mr. Walsh (Final Interview) discussed having roughly the same amount of participation between boys and girls, such as a talk pattern of “girl, girl, girl, boy, boy, boy, girl, boy, boy, girl.” Mr. Walsh (Final Debrief) further elaborated, “I try and balance boys and girls as much as I can, but if I’m going to err on one side, I try to err on the side of girls.” As Mr. Walsh’s statements illustrate, maintaining the relative equilibrium of balanced participation in a class was possible, yet he could still aim to promote greater participation in favor of a minoritized group.
We suspect invocations of balance may be related to teacher’s ideologies about race and gender. In 12 instances teachers invoked balance with regard to student participation, and 11 of them focused on gender, with only one instance focusing on race. In this single instance, Ms. Stone (Final Debrief) articulated a desire to balance two racial groups (Latinx and White), stating she wished they were “closer to being balanced.”
One possible explanation is the nature of the social marker categories themselves. On one hand, gender is typically, albeit problematically, construed as a binary variable. Indeed, in this study, teachers contrasted boys and girls and did not identify any nonbinary students. Given that they had only two possible categories, invoking a sense of balance was easy, almost like putting the two groups on the opposite sides of a scale. When teachers were given data about participation by race, multiple racial groups were always displayed. It is possible that an alternative representation, comparing only two racial groups at a time, would have more directly mediated cross-racial comparisons and the use of a balance logic.
Another possible explanation connects to ideologies about race and gender in the United States. Mr. Walsh (Final Interview) described how broader discourses constrained what is socially acceptable,
With race it’s a little tougher [than gender], because I don’t generally look and say, I haven’t talked to a Black kid today or had them answer a certain type of question. Boys and girls, it’s pretty cut and dried, right? It’s, like, man, four boys in a row have been up at the board. Can’t have that. … Doing this [action research project] this year has brought this more to the forefront. Trying to do some of those same things with racial minorities that I’ve done with girls over the years has, I think, changed some of those patterns of participation. It’s just something that I’ve always just been aware of with gender, and hence, implicit…I’ll start, and I notice that I gave the pens to go up and do stuff to boys. I’ll say, hey, pick a girl. Would I ever say, pick a Black kid? What would happen in the room at that point?
Here, Mr. Walsh contrasted the differences between talking about gender and race. Calling out gender imbalance is socially acceptable, but calling out race is less so. As he stated, saying he was going to “pick a Black kid” as an instructional practice would not be socially acceptable.
Equity as Reparation
The final social marker logic was equity as reparation. From a perspective of reparations, the “equity ratio line = 1” mediated thinking about a minimum benchmark for minoritized students. For instance, when talking about Latinx students, Ms. Baker (Round 5) described the equity ratio line as the “baseline that needed to be there,” and she expressed satisfaction when Latinx students, as a minoritized group in mathematics, were above that line. This particular logic connects to a broader ideology about reparations and the notion that present imbalances (e.g., in participation) are needed to counteract historical inequities. Mr. Walsh (Round 2) used similar logic to interpret the equity ratio line:
Ideally, I think every bar, right at the equity line, would be nice. That would look pretty, right? With what we know about girls’ engagement in STEM courses later on, I would really like to see them doing more why and how than the boys. I’m good with that green bar [for girls]… because I think we need to overcompensate a little bit. I’m good with that. I’d like to see the green above the equity bar a little bit for those. This is a zero sum. If one’s above, the other’s gonna be below. Okay, I’m good with that.
Mr. Walsh’s reference to a “pretty” visual distribution points to the salience of the “equity ratio = 1” line as a perceptual anchor. From this baseline, he then provided a correction to overcompensate for historically marginalized students. Mr. Walsh also articulated the reparation view other times, for instance, when he said (in Round 4), “The fact that the Latino one is above the equity ratio on both of those I’m happy that I was able to be pretty intentional about that.”
Individual
In addition to reasoning about social marker groups, teachers also attended to participation levels for their students as individuals. At times, individual logics were used to think of all students as equal (ignoring their backgrounds and social marker identities), while at other times social marker information was used to interpret the participation of individual students.
Equity Through Coverage
Teachers used the individual analytics to ensure that all students had at least some participation. Thus, the goal was to achieve coverage of the whole class, and if some students never participated, it signified inequity. All five teachers used equity through coverage logic. This logic was mediatedby looking at bars where students had zero participation. Teachers, like Ms. Smith (Round 3), noted “20 out of 30” students participating as “disappointing,” and Ms. Stone (Round 3), said, “Wow. 17 out of 29. That’s terrible.” Similarly, Ms. Davis (Final Debrief) said, “I was just viewing it as, are all students participating?” In all of these cases, the teachers wanted to make sure that all students had a chance to participate, regardless of their backgrounds.
The coverage logic drew attention to students who had zero participation. In her Final Interview, Ms. Baker discussed the “kids at zero,” through a metaphor of kids swimming,
Some kids just love to swim. They’re splashing around. They’re swimming out to the raft, jumping off the raft, swimming back, right? They’re not even thinking about it. They’re just swimming, right? There’s some kids that are wearing floaties, got them on their arms, whatever, the kid things, whatever. They’re pretty comfortable with that. With some support, they’re fine. We’ve got some kids, the kids at this other end, who are tied to cement blocks. They’re not thinking about swimming. They’re thinking about, how the h*** do I keep my head above water?
Ms. Baker described how she has always “struggled” to support those students, but that she “just focused on them more this year.” Here, what Ms. Baker described is a general recognition of the students who were not participating, but with the visual salience of “zeros” rather than a participation bar, it made her focus more attention on those particular students.
Equity Through Focus
The individual student graph also provided a means for teachers to focus on individual students. For instance, Ms. Baker (Round 1) said, “I’m really surprised at how infrequently… Brian, Mark, and Kevin [were called on]. I would have expected them to be called on more.” Here, the visual representation of students who were not called on often either having a “zero” above their name, or a bar with a short height, made it easy for teachers to focus on them. This awareness could then be used to implement practicesto increase their participation.
Notably, teachers also used the social marker graphs to identify individual students to support. Teachers often coordinated between the individual and social marker levels, using what they knew about their students both as individuals as members of particular groups.
To illustrate, consider Mr. Walsh in Round 3 and Round 4 debriefs. In Round 3, the interviewer drew Mr. Walsh’s attention to Latinx and Black students in the class. Recognizing that two Latinx students were in his class, Mr. Walsh used what he knew about them as individuals to interpret the “green bars for Latinx students.” He said “Marina’s … really taking the bull by the horns, and she’s got a ton of confidence.” In contrast, he said, “Jasmin, still, I worry about. If we looked at these contributions and which was which, I think Marina is dominating that.”
As these statements make clear, Mr. Walsh first noticed the aggregate description of Latinx student performance and then disaggregated it into individual students within that category. Mr. Walsh further elaborated how he was able to build “a relationship with” Marina, which made a huge difference. He contrasted this to Jasmin, who he didn’t think “trusts” him.
Similarly, Mr. Walsh used what he knew about his three Black students as individuals to understand the aggregate participation of Black students. Mr. Walsh described Luke as “smarter than heck,” while he said the other two students were “giving up” on him. Mr. Walsh described in depth how he was reaching out to Mo and trying to provide additional support. In the end, he concluded that he “was not happy with where we are with those three right now. That’s a major issue for me.” At the end of the debrief, Mr. Walsh changed his practice to include specific student names in his lesson plan to think strategically on how to incorporate these students into his lesson plan. During Debrief 4, Mr. Walsh reflected on this process.
I think it’s a mixed bag. I think for a couple of kids it worked really well. Jasmin and Mo particularly…. Part of the mixed bag is that I think assigning competence, that maybe I was looking for too quick of a turnaround for their attitudes, for their confidence to grow, and it hasn’t. That might have been looking for a magic bullet.
Mr. Walsh’s reflection shows the way he was able to use the quantitative data, which described disproportionately impacted groups in his classroom, to attend to specific students and incorporate them into his lesson planning to elevate their participation. Later in the same debrief, Mr. Walsh had a slightly more positive outlook of the focus on individual students:
That’s one of the other things I noticed and was going to bring up, just in terms of voluntary participation, that if you want to draw a broad, general connective conclusion, the kids that we focused individual attention on, it’s like the great Eye of Sauron. When we focus this laser light on certain kids, it clearly changes their participation.
Mr. Walsh described how the individual analytics supported him to focus on particular students, and that having the explicit focus was important to improving their participation.
Equity Through Redistribution
Teachers were reluctant to use the final logic, of redistribution. The logicof redistribution is that dominant students can take up a disproportionate amount of space, preventing other students from participating. In this study, we found that teachers did not utilize this way of thinking, even when explicitly prompted.
For example, in Round 3, the interviewer noted that one of Ms. Davis’s students, Bruce, had 60 out of the 300 participation sequences, or 20% of them, in a classroom with 30 students. Ms. Davis responded, “That is crazy.” Despite the interview’s suggestions to reduce the amount of participation from this student, she justified his participation, saying “I know he doesn’t feel that in all of his classes.” She continued that in other classes he gets “shut down, or he tries to share and nobody calls on him.” In her final debrief interview, Ms. Davis returned to Bruce, saying that she did not “ask him to temper his response in the class,” because she was aware of his frustration of how he was treated as a Latino boy in the school.
Why did teachers refrain from using this logic? On one hand, nothing perceptually in the data visualizations would make teachers think about reducing participation from a single student. Although a tall bar on the individual graph would stand out, what clearly stood out more for teachers were the students who were participating little to not at all. Another visualization (like a pie chart), may have influenced teacher thinking differently. At the same time, increasing student participation is more socially acceptable than thinking about reducing a students’ participation, even if such a move might actually support equity by creating space for other students.
Discussion
Our findings highlight how data visualizations supported teacher sensemaking of racial and gender inequity in classroom participation. Moreover, teachers did responded without dehumanizing students: social marker patterns were constantly compared with the teacher’s professional knowledge and what was known about students as individuals. The data analytics allowed teachers to identify inequities both for groups and individual students, which they had the potential to address with intentional changes to their teaching practices.
We identified a total of six prevalent teacher logics for making sense of equity. For social marker groups, teachers conceptualized equity as equality, balance, or reparation. We found that a single representation could mediate a variety of ways of thinking, depending on teacher ideologies. The “equity ratio = 1” line was seen as a target value for all groups to achieve (equity as equality), a general guideline for student participation (equity as balance), and as a minimum baseline for students from minoritized groups (equity as reparations).
Teacher logics for individuals aimed to create equity through coverage, focus, and redistribution. In this study, we found evidence only of the coverage and focus logics. All teachers utilized the coverage logic. The belief that all students should participate at least sometimes was intuitively appealing, and the large zeros above empty bars made this logic perceptually salient.
Similar to the coverage logic, the focus logic aimed to consider the experiences of particular students and ways to increase their participation. When students were viewed this way, background information about their social marker identities, experiences in other classes, or home life were drawn upon by teachers as relevant. The final logic, redistribution, was suggested by the interviewers but never adopted by teachers.
One limitation of the study is that the sample consisted entirely of white teachers. Research shows that white people in general (Bonilla-Silva, 2003; O’Brien & Korgen, 2007), and white teachers specifically (Hinojosa & Moras, 2009), much more readily embrace a colorblind ideology and may be averse to seeing the oppressive impacts of racism in society. As such, we suspect that a similar study with teachers of color, they may have been able to connect structural racism to impacts on individual students in their classroom more readily, which would have influenced their interpretation of the data analytics. Indeed, preliminary evidence from our professional development work does suggest that teachers of color may be better equipped to interpret and immediately act upon data showing racial inequity (Reinholz et al., 2019). Nonetheless, evidence showing that the white teachers in the study were able to productively grapple with racial inequity in their classes is a promising sign.
Implications and Future Directions
This study has a number of implications for teacher education. First, we found that providing disaggregated data analytics prompted teachers to reflect on racial and gender inequities in their classrooms. In this way, the data analytics helped move beyond thinking about the classroom as a whole, to draw attention to individual students and social marker groups. We argue that this step is necessary to take seriously calls for equity in mathematics education.
Second, we demonstrated that simply providing data is not enough. For instance, we documented cases where teachers utilized an equity as equality logic in a way that could actually cause harm to students from minoritized groups (e.g., girls or Black students), because their participation was higher than would be expected by demographic representation alone. A single data representation can be interpreted using a variety of logics. Thus, teacher educators must consider the complex relationships between ideologies, practices, mediating artifacts, and teacher logics to help promote productive lines of reasoning for teachers.
Third, our work suggests that particular representations have salient features that could mediate particular types of thinking. In general, we found that the “equity ratio = 1” link seemed to prompt teachers to use equity as equality, although it could also be used to promote other ways of thinking. Similarly, the presence of zeros over empty bars in the individual student bar graph drew special attention to the students who were not participating. Accordingly, we suspect that through intentional design, new data visualizations may be able to nudge teachers to use particular logics to reason about students.
For example, if we wanted to invoke a sense of balance between racial groups, it might be achieved more productively by visualizing participation from only two groups at a time, rather than showing all of the racial groups in the class. We further hypothesize that creating visuals focusing explicitly on target groups could help teachers do better to support them, while avoiding zero-sum pitfalls. The ways in which analytics can be designed to cue particular forms of thinking explicitly is an important area of future research.
Note
This material is based upon work supported by the Spencer Foundation and the National Science Foundation under Grant No. 1943146.
References
Banes, L. C., Ambrose, R. C., Bayley, R., Restani, R. M., & Martin, H. A. (2018). Mathematical classroom discussion as an equitable practice: Effects on elementary English learners’ performance. Journal of Language, Identity & Education, 17(6), 416–433. https://doi.org/10.1080/15348458.2018.1500464
Bonilla-Silva, E. (2003). Racism without racists: Color-blind racism and the persistence of racial inequality in the United States. Rowman & Littlefield Publishers.
Boyatzis, R. E. (1998). Transforming qualitative information: Thematic analysis and code development. Sage.
Braaten, M., Bradford, C., Kirchgasler, K. L., & Barocas, S. F. (2017). How data use for accountability undermines equitable science education. Journal of Educational Administration, 55(4), 427–446. https://doi.org/10.1108/JEA-09-2016-0099
Braaten, M., & Windschitl, M. (2011). Working toward a stronger conceptualization of scientific explanation for science education. Science Education, 95(4), 639–669.
Bullock, E., Gholson, M., & Alexander, N. (2012). On the brilliance of Black children: A response to a clarion call. Journal of Urban Mathematics Education, 5(1), 1–7.
Chi, M. T. H., De Leeuw, N., Chiu, M. H., & LaVancher, C. (1994). Eliciting self-explanations improves understanding. Cognitive Science, 18(3), 439–477. https://doi.org/10.1016/0364-0213(94)90016-7
Cohen, E. G., & Lotan, R. A. (1997). Working for equity in heterogeneous classrooms: Sociological theory into practice. Teachers College Press.
Crenshaw, K. (1990). Mapping the margins: Intersectionality, identity politics, and violence against women of color. Stanford Law Review, 43(6), 1241–1300.
Datnow, A., & Hubbard, L. (2016). Teacher capacity for and beliefs about data-driven decision making: A literature review of international research. Journal of Educational Change, 17(1), 7–28. https://doi.org/10.1007/s10833-015-9264-2
Ernest, P. (1992). The popular image of mathematics. Humanistic Mathematics Network Journal, 1(8), 53–55.
Ernest, J. B., Reinholz, D. L., & Shah, N. (2019). Hidden competence: Women’s mathematical participation in public and private classroom spaces. Educational Studies in Mathematics. https://doi.org/10.1007/s10649-019-09910-w
Farrell, C. C., & Marsh, J. A. (2016). Metrics matter: How properties and perceptions of data shape teachers’ instructional responses. Educational Administration Quarterly, 52(3), 423–462. https://doi.org/10.1177/0013161X16638429
Garner, B., Thorne, J. K., & Horn, I. S. (2017). Teachers interpreting data for instructional decisions: Where does equity come in? Journal of Educational Administration, 55(4), 407–426. https://doi.org/10.1108/JEA-09-2016-0106
Gonzalez, R., & Ayala-Alcantar, C. U. (2008). Critical caring: Dispelling Latino stereotypes among preservice teachers. Journal of Latinos and Education, 7(2), 129–143. https://doi.org/10.1080/15348430701828699
Greenwald, A. G., & Banaji, M. R. (1995). Implicit social cognition: Attitudes, self-esteem, and stereotypes. Psychological Review, 102(1), 4.
Hall, S. (1985). Signification, representation, ideology: Althusser and the post‐structuralist debates. Critical Studies in Mass Communication, 2(2), 91–114. https://doi.org/10.1080/15295038509360070
Herbel-Eisenmann, B., & Shah, N. (2019). Detecting and reducing bias in questioning patterns. Mathematics Teaching in the Middle School, 24(5), 282–289.
Hinojosa, M., & Moras, A. (2009). Challenging colorblind education: A descriptive analysis of teacher racial attitudes. Sociology Faculty Publications. https://digitalcommons.sacredheart.edu/sociol_fac/6
Horn, I. S. (2007). Fast kids, slow kids, lazy kids: Framing the mismatch problem in mathematics teachers’ conversations. Journal of the Learning Sciences, 16(1), 37–79. https://doi.org/10.1080/10508400709336942
Horn, I. S., Kane, B. D., & Wilson, J. (2015). Making sense of student performance data: Data use logics and mathematics teachers’ learning opportunities. American Educational Research Journal, 52(2), 208–242. https://doi.org/10.3102/0002831215573773
Krathwohl, D. R. (1998). Methods of educational and social science research: The logic of methods (2nd ed.). Waveland Press.
Larnell, G. V., Boston, D., & Bragelman, J. (2014). The stuff of stereotypes: Toward unpacking identity threats amid African American students’ learning experiences. Journal of Education, 194(1), 49-57. https://doi.org/10.1177/002205741419400107
Lewis, K. L., Stout, J. G., Pollock, S. J., Finkelstein, N., & Ito, T. A. (2016). Fitting in or opting out: A review of key social-psychological factors influencing a sense of belonging for women in physics. Physical Review Physics Education Research, 12(2), 020110. https://doi.org/10.1103/PhysRevPhysEducRes.12.020110
Lubienski, S. T., & Ganley, C. M. (2017). Research on gender and mathematics. In J. Cai (Ed.), Compendium for research in mathematics education (pp. 649–666). National Council of Teachers of Mathematics.
Martin, D. B. (2019). Equity, inclusion, and antiblackness in mathematics education. Race Ethnicity and Education, 22(4), 459–478. https://doi.org/10.1080/13613324.2019.1592833
McAfee, M. (2014). The kinesiology of race. Harvard Educational Review, 84(4), 468–491. https://doi.org/10.17763/haer.84.4.u3ug18060x847412
McDermott, R. P. (1993). The acquisition of a child by a learning disability. In S. Chaiklin & J. Lave (Eds.), Understanding practice (pp. 269–305). Cambridge University Press.
Nasir, N. S. (2002). Identity, goals, and learning: Mathematics in cultural practice. Mathematical Thinking and Learning, 4(2–3), 213–247. https://doi.org/10.1207/S15327833MTL04023_6
O’Brien, E., & Korgen, K. O. (2007). It’s the message, not the messenger: The declining significance of black–white contact in a “colorblind” society. Sociological Inquiry, 77(3), 356–382. https://doi.org/10.1111/j.1475-682X.2007.00197.x
O’Connor, C., Michaels, S., Chapin, S., & Harbaugh, A. G. (2017). The silent and the vocal: Participation and learning in whole-class discussion. Learning and Instruction, 48, 5–13. https://doi.org/10.1016/j.learninstruc.2016.11.003
Radford, L. (2003). Gestures, speech, and the sprouting of signs: A semiotic-cultural approach to students’ types of generalization. Mathematical Thinking and Learning, 5(1), 37–70.
Reinholz, D. L. (2016). The assessment cycle: A model for learning through peer assessment. Assessment & Evaluation in Higher Education, 41(2), 301–315. https://doi.org/10.1080/02602938.2015.1008982
Reinholz, D. L., Bradfield, K., & Apkarian, N. (2019). Using analytics to support instructor reflection on student participation in a discourse-focused undergraduate mathematics classroom. International Journal of Research in Undergraduate Mathematics Education, 5(1), 56–74. https://doi.org/10.1007/s40753-019-00084-7
Reinholz, D. L., & Shah, N. (2018). Equity analytics: A methodological approach for quantifying participation patterns in mathematics classroom discourse. Journal for Research in Mathematics Education, 49(2), 140–177.
Reinholz, D. L., Stone-Johnstone, A., & Shah, N. (2019). Walking the walk: Using classroom analytics to support instructors to address implicit bias in teaching. International Journal for Academic Development, 25(3), 259-272. https://doi.org/10.1080/1360144X.2019.1692211
Reinholz, D. L., Stone-Johnstone, A., White, I., Sianez, L. M., & Shah, N. (2020). A pandemic crash course: Learning to teach equitably in synchronous online classes. CBE—Life Sciences Education, 19(4), ar60. https://doi.org/10.1187/cbe.20-06-0126
Robinson-Cimpian, J. P., Lubienski, S. T., Ganley, C. M., & Copur-Gencturk, Y. (2014). Teachers’ perceptions of students’ mathematics proficiency may exacerbate early gender gaps in achievement. Developmental Psychology, 50(4), 1262–1281. https://doi.org/10.1037/a0035073
Saket, B., Endert, A., & Demiralp, Ç. (2019). Task-based effectiveness of basic visualizations. IEEE Transactions on Visualization and Computer Graphics, 25(7), 2505–2512. https://doi.org/10.1109/TVCG.2018.2829750
Schildkamp, K. (2019). Data-based decision-making for school improvement: Research insights and gaps. Educational Research, 61(3), 257–273. https://doi.org/10.1080/00131881.2019.1625716
Secada, W. G. (1989). Educational equity versus equality of education: An alternative conception. In W. G. Secada (Ed.), Equity in education (pp. 68–88). Falmer.
Shah, N. (2017). Race, ideology, and academic ability: A relational analysis of racial narratives in mathematics. Teachers College Record, 119(7), 1–42.
Shah, N., Christensen, J. A., Ortiz, N. A., Nguyen, A., Byun, S., Stroupe, D., & Reinholz, D. L. (2020). Racial hierarchy and masculine space: Participatory in/equity in computational physics classrooms. Computer Science Education, 30(3), 254-278. https://doi.org/10.1080/08993408.2020.1805285
Shah, N., Herbel-Eisenmann, B., & Reinholz, D. L. (2020). Why Mrs. Stone never calls on Debra: A case of race-gender ideology in practice. In M. Gresalfi & I. S. Horn (Eds.), The Interdisciplinarity of the Learning Sciences, 14th International Conference of the Learning Sciences (ICLS) 2020, Volume 1 (pp. 1974–1981). International Society of the Learning Sciences.
Shah, N., & Lewis, C. M. (2019). Amplifying and attenuating inequity in collaborative learning: Toward an analytical framework. Cognition and Instruction, 37(4), 423-452. https://doi.org/10.1080/07370008.2019.1631825
Stinson, D. W. (2008). Negotiating sociocultural discourses: The counter-storytelling of academically (and mathematically) successful African American male students. American Educational Research Journal, 45(4), 975–1010. https://doi.org/10.3102/0002831208319723
Szafir, D. A. (2018). The good, the bad, and the biased: Five ways visualizations can mislead (and how to fix them). Interactions, 25(4), 26–33.
Van Gasse, R., Vanlommel, K., Vanhoof, J., & Van Petegem, P. (2016). Teacher collaboration on the use of pupil learning outcome data: A rich environment for professional learning? Teaching and Teacher Education, 60, 387–397. https://doi.org/10.1016/j.tate.2016.07.004
![]()