Science, technology, engineering, and math (STEM) continue to play an increasingly salient role in global education policy, particularly in the United States of America. According to the National Science Board’s (2006) report, “America’s Pressing Challenge — Building a Stronger Foundation,” the 21st-century workforce demands college graduates trained and capable in STEM fields to contribute to a strong economy and to be competitive at the international level. Additionally, the report asserted that K-12 education in key principles and STEM applications is a critical foundation to an informed, engaged citizenry. Despite this well-documented need, the U.S.A. ranked 20th in the measure of 24-year-olds who earn degrees in natural science or engineering (Kuenzi, 2008). A more recent report found that less than10% of high school students take one credit or more of engineering technology (Frase, Latanision, & Pearson, 2016).
The need for STEM-educated candidates is demonstrated in the U.S.A. job market, with estimates of 2 million to 3 million unfilled positions due to a lack of skilled applicants—a trend that is expected to increase (Atkinson, 2013; U. S. News, 2012). Competency gaps between the skills industry leaders seek in new employees and what educational programs provide include, “professionalism/work ethic, teamwork/collaboration, oral communications, ethics/social responsibility, critical thinking/problem solving, information technology application…lifelong learning/self-direction,” among others (Casner-Lotto & Barrington, 2006, p. 21). Providing students with experiences beyond traditional lecture and laboratory instruction, by incorporating rich integrated STEM learning opportunities, provide avenues to incorporate these skills. Teachers may be left searching for an interesting project to hook their students’ attention while teaching core content and skills. We used a solid-body electric guitar as a vehicle to teach integrated STEM concepts. The guitar can be used as an opportunity to talk about the chemistry of finishes (and swirl dipping), circuits, wave behavior, supply chains, engineering design, electromagnetism, the mathematics of music, as well as many other engaging topics.
Additionally, many U.S.A. states are transitioning to the Next Generation Science Standards (NGSS). The NGSS offer K-12 science teachers a framework to implement integrated STEM and problem-based learning (PBL) approaches comprised of four components: (a) Disciplinary Core Ideas (DCIs), (b) Crosscutting Concepts (CCCs), (c) Science and Engineering Practices (SEPs), and (d) Student Performance Expectations (NGSS Lead States, 2013). Three-dimensional learning occurs when students successfully demonstrate knowledge of DCIs, CCCs, and SEPs in the Student Performance Expectations.
This three-dimensional learning model represents a shift from traditional content-based standards. For example, within the eight SEPs, students must be able to gain experience by modeling behavior of scientists and engineers through science coursework. Technology is incorporated throughout the SEPs, in which students are expected to plan and carry out investigations in a lab setting, analyze data, develop and use models, and implement mathematics and computational thinking through a wide array of technologies (NGSS Lead States, 2013).
In response to the national STEM initiatives, the transition to the NGSS, and the prevalence of employee STEM skills gaps, the STEM Guitar Project funded by a grant from the National Science Foundation was created. The grant offers weeklong faculty professional development (PD) institutes (hereafter referred to as, Institutes) where in-service teachers in grades 6-16 receive training on how to build a solid-body electric guitar and how to implement integrated STEM curriculum revolving around 12 core Modular Learning Activities (MLAs) created by the grant team.
The MLAs cover a variety of topics including computer aided design (CAD)/computer-aided manufacturing (CAM) design, intonation, electricity/electronics, guitar geometry, cost analysis of the guitar, material properties, and other STEM topics. The technology embedded in each of these 12 MLAs goes beyond the traditional use of presentation software and using computers to look up information, with technology components embedded in these MLAs for hands-on, PBL. These skills highlighted in the MLAs aim fill needs as described by the STEM Guitar Project industry partners and advisory panel, including Boeing, Forest Scientific, Fender Guitars, and Taylor Guitars.
The teachers are equipped to customize the implementation of the MLAs to best suit students’ needs. In order to receive stipend funding from the grant, each teacher must implement two or more MLAs with students in combination with pre- and postassessments, which are later analyzed to determine student learning gains. Improvement in student scores from pre- to postassessment is the method used to evaluates the success of the Institutes. Various technological tools, such as oscilloscopes, Microsoft Excel spreadsheets, multimeters, and CAD/CAM systems, are integral to both the lessons and the guitar building process.
Literature Review
Technology is a nebulous term that can mean many different things and is often limited to computers, particularly in education (National Research Council, 2012). This research uses the broad definition featured in the NGSS Framework, “…to include all types of human-made systems and processes” (National Research Council, 2012, p. 11). The NGSS Framework further stated, “Technologies result when engineers apply their understanding of the natural world and of human behaviors to satisfy human needs and wants” (p. 12).
Teachers—and ultimately their students—participating in the grant activities utilized various technologies to construct, diagnose, fix, modify, improve, and customize their guitars. These teachers also used various technologies to supplement the integrated STEM learning experiences. Table 1 shows the various technologies embedded in the 12 core MLAs.
Table 1
The 12 Core STEM Activities Mapped to Related Technology Component(s)
| 12 Core STEM Activities | Technology Component |
| Guitar Geometry | Geometrical sketches, architectural sketch tools, creating scaled drawings |
| CAD/CAM | CAD/CAM software and systems |
| Electronics | Multimeters |
| Material Properties of Wood | Dial/digital calipers, digital scales |
| Guitar Anatomy | Excel Spreadsheet (maybe more generic way of stating spreadsheet) |
| Threaded Fasteners | Dial/digital calipers, measuring devices, calculators |
| Scale Length | Dial/digital calipers, measuring devices, calculators |
| Tolerances | Dial/digital calipers, measuring devices, calculators |
| Fret Spacing | String radius gauge, string height gauge, feeler gauges, other measuring devices |
| Set Up | Measuring devices, calculators |
| Guitar Neck Intonation | Oscilloscopes, guitar tuners, guitar tuning apps for personal devices |
However, with shifting educational focuses, non-technology-education teachers are being called upon to teach technology and engineering (Barlex, 2007). This call is in conjunction with other movements seeking to incorporate STEM concepts with interdisciplinary subjects, such as humanities. Examples of such movements include STEAM (STEM plus the arts), and STREAM (reading or writing, combined with STEAM; Bernstein & Bernstein, 2011).
With the integration of the arts and humanities in STEM initiatives, teachers of these disciplines are being called upon to teach STEM concepts, particularly technology and engineering concepts such as design, the iterative engineering process, and CAD/CAM systems (Barlex, 2007). Because arts and humanities teachers are teaching concepts outside of their field of study, additional PD focusing on the integration of STEM plus the arts and humanities is needed. This article uses the term STEM teachers to describe teachers who primarily teach STEM concepts and the term non-STEM teachers to describe those who primarily teach humanities or arts but are called upon to incorporate STEM into their curriculum or who may implement STEM components into an afterschool program or club.
Additionally, many STEM teachers receive training in only one or perhaps two disciplines; teachers may have experience with only one or two components of STEM but are expected to teach integrated STEM concepts, rendering teaching integrated STEM difficult (Burrows & Slater, 2015; Loucks-Horsley, Stiles, Mundry, Love, & Hewson, 2010). Another issue is that, while the number of available STEM jobs is increasing, the number of preservice teacher preparation programs in technology and engineering education have been decreasing over the last 40 years (Atkinson, 2013; Kelly, 2012; Litowitz, 2014). Traditionally, technology and engineering concepts have been taught through vocational programs and industrial arts classes but are now “adopting a more academic program of study, including material related to the STEM subjects” (Honey, Pearson, & Schweingruber, 2014, p. 17). Technology and engineering concepts are now being shifted to the core subject curriculum, as evidenced by technology and engineering standards in the NGSS and Common Core.
Furthermore, teachers’ perceptions, beliefs, and self-efficacy may determine their instructional decisions. Teachers’ prior experiences—coupled with PD—can increase teachers’ self-efficacy with teaching PBL, a type of pedagogy often implemented when teaching STEM (Burrows, Borowczak, Slater, & Haynes, 2012; Hodges, Gale, & Meng, 2016; Jones & Leagon, 2014). Research shows that a minimum of 50 hours of PD is needed in order to create change in teachers’ instruction (Wei, Darling-Hammond, Andrew, Richardson, & Orphanos, 2009), and the Institutes PD meets this requirement. A change in teachers’ instruction may be evidenced by student learning gains within that content area; the grant faculty PD institutes were designed to meet the criteria for effective PD, which were mapped to relevant core content standards and should, thus, lead to student learning gains (as asserted in Loucks-Horsley et al., 2010).
STEM and non-STEM teachers alike search for avenues to incorporate STEM into their curriculum. One avenue for teachers of all disciplines to incorporate STEM concepts (and its derivative forms) is through PBL (Honey et al., 2014). PBL is one type of experiential learning where students tackle an often ill-defined problem in cooperative learning groups (Hmelo-Silver, 2004). Hmelo-Silver described five goals of PBL as “(a) flexible knowledge, (b) effective problem-solving skills, (c) self-directed learning (SDL) skills, (d) effective collaboration skills, and (e) intrinsic motivation” (p. 235).
PBL encourages students to identify a problem, determine what is needed to solve the problem, and collaboratively work to solve that problem (Mossuto, 2009). Incorporating PBL with STEM has been shown to “generate meaningful learning and influence student attitudes in future career pursuit” (Tseng, Chang, Lou, Chen, 2013, p. 87).
The grant work described here not only incorporates integrated STEM instruction, but also instruction and best practices for implementing PBL. When constructing an electric guitar, problems naturally arise due to student error, manufacturing errors, and other unforeseen issues. Students need to identify these problems—such as the characteristic buzz of a high fret wire or the sound of a bad tone or volume potentiometer—and find ways to solve them. Incorporating PBL has been shown to increase student engagement and student learning gains, particularly among at-risk students (Heitin, 2012; Mossuto, 2009).
Rationale
Technology is an essential part of integrated STEM education, is often incorporated in PBL, and is utilized in conjunction with STEM integration in the humanities and the arts. For science teachers, technology is embedded in the SEPs of the NGSS. Because technology is at the forefront of national science and STEM initiatives, the purpose of this research study was to partially fill a gap in the literature proposed in STEM Integration in K-12 Education: Status, Prospects, and an Agenda for Research (Honey et al, 2014), which asked, “How should integrated STEM experiences be designed to account for educators’ and students’ varying levels of experience with integrated learning and STEM content?” (p. 10).
Research Questions
The following research questions guided this study:
- Did the implementation of MLAs by STEM and non-STEM teachers participating in the STEM Guitar Institute result in grade 6-16 student gains for the 12 MLAs, as evidenced by their pre- and postassessment scores?
- Is there a difference in learning gains between grade 6-16 students taught by STEM teachers and students taught by non-STEM teachers, as measured by pre- and postassessment gains?
Because this research focused on participating teachers’ collaborative PBL experiences within the Institutes (and, ultimately their students’ collaborative learning experiences in the classroom), a social constructionism theoretical framework was incorporated (Koro-Ljungberg, Yendol-Hoppey, Smith, & Hayes, 2009). This study compared grades 6-16 students’ quiz scores on the 12 core MLAs in STEM and non-STEM teachers’ classes to see if there was a statistically significant difference pre- to postinstruction. To assess the changes in students’ learning gains after collaboratively working through the MLAs, pre- and postassessment scores were used.
Description
The grant offered a weeklong PD for teachers of grades 6-16. Participating teachers attended the Institute for at least 8 hours per day for 5 days during the week. In addition to attending an informational webinar prior to the institute, teachers completed learning activities outside of the allotted institute meeting time.
Approximately 25 hours of the workshop was dedicated to teachers building their own solid-body electric guitar. The remaining 15 hours of the weeklong institute was dedicated to classroom time, where teachers learned about the NGSS, practiced integrating STEM effectively into their curricula, developed their own guitar-themed MLA, and collaborated with other teachers to develop an implementation plan. The Institutes were taught by a team of STEM professionals from diverse backgrounds, including STEM education, physics, mathematics, engineering, engineering technology, educational technology, and drafting. All Institute leaders were veteran STEM educators spanning grades K-16.
The guitar kits were comprised of a precut wood guitar body, a maple precut neck, and a preslotted fretboard. Teachers were tasked with using hand and power tools to shape, sculpt, and sand the guitar body. Teachers sketched and cut out their headstock design (either by hand or a CAD/CAM-system), at which point the fretboard was attached to the neck. Teachers then soldered the electric guitar components and received instruction on how the electromagnetic guitar pickups work.
During the grant’s classroom time, teachers received PD on national standards related to STEM (NGSS, Common Core, etc.). At the end of the week, teachers worked collaboratively to describe their plans to use the guitar as a vehicle to teach integrated STEM.
During the Institute, participating teachers also worked through 12 core MLAs, developed by the content experts on the grant team. Teachers were expected to arrive to the workshop with the Guitar Anatomy MLA completed, requiring participants to source guitar parts on the Internet and record the price of parts. This activity provided an opportunity for teachers to become familiar with guitar parts, costs, and potential suppliers. It was also an opportunity to use an Excel spreadsheet in a lesson.
During the Institute, teachers worked through the Fret Spacing Calculation MLA and the Threaded Fasteners MLA. When working through these MLAs, teachers were instructed to and then envisioned themselves as students, which was a key component of effective PD (Loucks-Horsley et al., 2010). Participating teachers who wished to receive a monetary incentive taught two MLAs and assessed students’ core knowledge regarding the MLAs with a pre and postassessment and submitted their students’ scores to the grant team. Teachers choose the two MLAs that best fit their grade and content area.
Throughout the Institute, participating teachers gained experience with a broad range of new technologies. As stated earlier, teachers researched the cost of guitar parts to calculate the total cost of assembling a guitar, requiring the use of an Excel spreadsheet. Teachers also learned how to download and use a soundcard oscilloscope to intonate their guitar. Depending on the available technology of the site, teachers created their headstock and cut it on a CNC machine using CAD/CAM technology. Additionally, teachers utilized the grant’s online community forum, learning how to post a question and provide a response.
The 12 core grant MLAs were aligned to all four sections of the NGSS (e.g., Disciplinary Core Ideas, Crosscutting Concepts, Science and Engineering Practices, and Student Performance Expectations) to incorporate three-dimensional instruction as well as Common Core State Standards in mathematics, as shown in Appendix A. Because the focus of this research study is on the integration of technology, only the table showcasing the alignment of the 12 core STEM MLAs aligned with the science and engineering practices is included (see www.guitarbuilding.org for the alignment of the 12 core MLAs to the remaining components of the NGSS). With the 12 core MLAs, students can access multiple opportunities to gain experience with the science and engineering practices.
In addition to being aligned to the science and engineering practices, each MLA contains specific technology components. Table 1 shows the specific technology components related to each of core MLAs.
Methods
Participants
Participants in this study included 769 students from three grade bands: grades 6-8, 9-12, and community college/undergraduate level from 15 states. STEM and non-STEM faculty from middle schools, high schools, and colleges were recruited for institutes held between 2013 and 2016. The institute outcomes were publicized to faculty through a range of media and opportunities, including
- Publications and websites of participating education partners and supporters;
- National listservs and websites of organizations, such as the Society for Manufacturing Engineers, Industrial Technology Education Association, American Society of Engineering Education, Project Lead the Way, and the National Association of Industrial Technology;
- Personal contacts through dissemination activities.
Faculty members applying to the Institute submitted a completed application by March 1 for institutes occurring in that same year. The application collected information about teaching experience (grade, STEM level, subjects, number of years of experience, etc.) and demographics of their school and students.
The 5-day institute agenda included instruction, demonstration, applied learning assignments, tours, and information about entrepreneurship, supply chain management, and state and national standards for STEM. The institute curriculum tied to workforce skill gap needs and STEM concepts, including basic physical science principles and fabrication processes and provided the opportunity to excite and engage participants as they built their guitars.
During the institutes, faculty participants were presented with prepared teaching modules and conducted experiments that demonstrated specific principles from the STEM disciplines. At the close, participants gained a clear understanding of how to make an electric guitar and how to integrate varied STEM subjects and learning activities through guitar building.
Data Collection
Student mastery of the 12 core MLA concepts was measured through the deployment of pre- and postassessments evaluating student knowledge across the 12 core concepts. The quizzes were deployed through a site license of Quia—software designed for online assessment—for which all faculty institute participants were given an account. Each participant’s Quia account was associated with the grant’s Quia site license in such a manner that all quiz results were accessible through the administrator account. The quiz results included assessment title, student project-related ID, faculty project-related ID, and course title.
Student scores for the 12 pre- and postassessments were highly reliable, with a reliability coefficient of 0.835. A review of the corrected item-total correlations suggests that the elimination of one assessment—Guitar Anatomy—would increase the reliability coefficient to 0.895. However, due to the already high reliability of the 12 assessments collectively, the elimination of the Guitar Anatomy pre- and postassessment data was not warranted.
Sample questions on the pre- and postassessments included the following:
Select the correct equation to locate the 2nd fret on the neck of a 13.5″ scale length mandolin neck using the formula: Dn = [(L – Dn – 1) ÷ 17.817] + Dn – 1; and B) If a guitar has an approximate surface area of 500-square inches, how many coats of paint is possible from a 50-mL tin of paint that covers approximately 1.0 square meters of surface area?
A sample assessment from the Fret Spacing activity is located in Appendix B. The complete set of activities and assessments is available at www.guitarbuilding.org.
Sample and Analysis
The sample included pre- and postassessment scores collected between 2013 and 2016. The dataset’s collection, composition, and analysis procedures were reviewed and approved by the University of Cincinnati Institutional Review Board. The dataset included 3,620 student assessment scores from a total of 769 individual students taught by 36 individual faculty institute participants. Each score was matched to the corresponding MLA, student project-related ID, faculty project-related ID, faculty gender, area of instruction (science, technology, engineering, math, or non-STEM), school socioeconomic status information, underrepresented student population, grade-levels served, and location.
Guided by the research question, the team focused the analysis on the difference between pre- and postassessment scores per MLA, comparing gains in scores from students taught by STEM instructors (drafting, chemistry, physics, algebra, mechanical engineering, etc.) to those taught by non-STEM instructors (humanities, art, music, etc.). The dataset was analyzed using Statistical Package for the Social Sciences (SPSS).
Descriptive statistics were performed on the total number of paired samples. The sample included 769 students from 15 states: Arizona, Colorado, Connecticut, Idaho, Illinois, Indiana, Maine, Nebraska, Nevada, Ohio, Oregon, Pennsylvania, Washington, and Wyoming. The students completed the grant’s curriculum while enrolled in courses in the following subject areas: science (29.9%), technology (18.6%), engineering (30.0%), math (8.5%), architecture (5.6%), humanities (1.8%), and music (5.6%). The majority of the students were enrolled at schools serving grades 9-12 (66.6%) followed by colleges (31.6%) and schools serving grades 6-8 (1.8%).
Our initial analysis investigated the normality and homogeneity of the sample. Due to the nonnormal nature of the data, we proceeded with nonparametric analysis methods, comparing pre- and postassessment scores using the Wilcoxon signed ranks test. Additionally, the STEM and non-STEM scores were compared using Mann–Whitney U test. An alpha level of 0.05 was used for all statistical tests.
Results
Overall Improvement Between Pre- and Postassessments
Descriptive statistics of the sample showed an increase in scores for each of the 12 MLAs. As evident in Figure 1, each mean postassessment score was higher than the corresponding mean preassessment score across all instructors—STEM and non-STEM. The assessment quizzes ranged from 10 to 15 questions each.
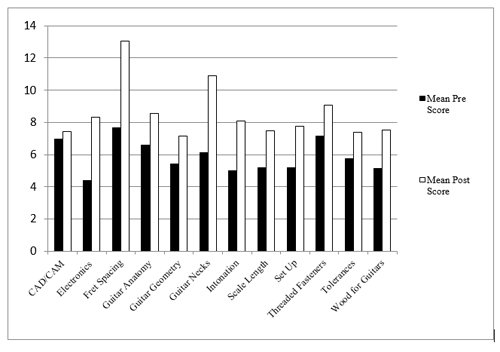
Changes in mean score from pre- to postassessment ranged from relatively small increases for CAD/CAM (6.6%), Threaded Fasteners (26.7%), and Guitar Anatomy (30.4%) to major increases for Electronics (90.4%), Guitar Necks (78.3%), and Fret Spacing (70.2%). The pre- and postassessment mean scores are shown in Table 2, all of which were significant at the p < 0.05 level. Within these quizzes, students demonstrated their knowledge of the mathematics of fret spacing, modeling the tension on a neck from the truss rod using CAD software, using a multimeter to test for continuity in a circuit, introductory circuits, fasteners (in metric and English units), and reading technical diagrams, among other STEM topics.
Table 2
Pre- and Postassessment Mean Scores
| Assessment | Rank | N | Z | Level of Significance |
| CAD/CAM (n = 57) | Negative Positive Tie | 15 29 13 | -2.464 | p < 0.05 |
| Electronics (n = 173) | Negative Positive Tie | 2 156 15 | -10.875 | p < 0.001 |
| Fret Spacing (n = 138) | Negative Positive Tie | 22 106 10 | -8.286 | p < 0.001 |
| Guitar Anatomy (n = 271) | Negative Positive Tie | 30 192 49 | -10.860 | p < 0.001 |
| Guitar Geometry (n = 115) | Negative Positive Tie | 18 74 23 | -6.524 | p < 0.001 |
| Guitar Necks (n = 27) | Negative Positive Tie | 4 20 3 | -3.955 | p < 0.001 |
| Intonation (n = 43) | Negative Positive Tie | 8 31 4 | -4.172 | p < 0.001 |
| Scale Length (n = 63) | Negative Positive Tie | 12 40 11 | -4.987 | p < 0.001 |
| Set Up (n = 26) | Negative Positive Tie | 3 17 6 | -2.811 | p < 0.01 |
| Threaded Fasteners (n = 149) | Negative Positive Tie | 34 106 9 | -7.056 | p < 0.001 |
| Tolerances (n = 62) | Negative Positive Tie | 10 44 8 | -4.227 | p < 0.001 |
| Wood for Guitars (n = 100) | Negative Positive Tie | 10 85 5 | -7.356 | p < 0.001 |
Analysis of the pre- and postassessment scores using the Wilcoxon signed ranks test demonstrated a statistically significant increase in student scores for each of the 12 MLAs, as documented in Hauze, French, Castaneda-Emenaker, French, & Singer, 2017). The Electronics MLA assessment (z = -10.875, p < 0.001) showed the most improvement, with only 1.2% negatively ranked scores, 90.1% positively ranked scores, and 8.7% scores tied. Other rank comparisons that stand out included the Fret Spacing MLA assessment (z = -8.286, p < 0.001), with 15.9% negatively ranked scores, 76.8% positively ranked scores, and 7.2% scores tied, as well as the Guitar Anatomy MLA assessment (z = -10.860, p < 0.001), with 11.1% negatively ranked scores, 70.8% positively ranked scores, and 18.1% scores tied.
The CAD/CAM MLA assessment (z = -2.464, p < 0.05) showed the least improvement, with 26.3% of scores negatively ranked, 50.9% scores positively ranked, and 22.8% of scores tied, followed by the Set Up MLA assessment (z = -2.811, p < 0.01), with 11.5% of scores negatively ranked, 65.4% scores positively ranked, and 23.1% of scores tied.
Gains Across STEM and Non-STEM Disciplines
Due to the relationship between the MLAs and national curriculum standards outlined in Appendix A, the gains across MLAs represent gains across disciplines. Additionally, the array of STEM and non-STEM subjects in which the grant’s curriculum was implemented further demonstrates the interdisciplinary nature of these findings. In order to determine if STEM teachers were more effective at integrating technology than were non-STEM teachers, the Mann-Whitney U test was used to compare gains between pre- and postquiz scores, and the results are shown in Tables 4 and 5.
The output of the Mann-Whitney U test statistics shown in Table 3 demonstrates there are significant differences between pre and post score gains of STEM teachers and non-STEM teachers for only two quizzes: Set Up (p < 0.05) and CAD/CAM (p < 0.005). There are no significant differences between pre and post score gains of STEM teachers and non-STEM teachers for the remaining quizzes. Scale Length and Guitar Necks were omitted from the Mann-Whitney U test comparison due to insufficient data.
Table 3
Mann-Whitney U Test Statistics
| Test Type | Wood | Tolerances | Fasteners | Set Up | Intonation | Geometry | Anatomy | Fret Spacing | Electronics | CAD/CAM |
| Mann-Whitney U | 501.000 | 136.500 | 684.000 | 15.500 | 83.500 | 1192.500 | 2680.500 | 1498.000 | 747.500 | 100.500 |
| Wilcoxon W | 579.000 | 1732.500 | 762.000 | 36.500 | 786.500 | 1822.500 | 33556.500 | 2128.000 | 838.500 | 155.500 |
| Z | -.287 | -.755 | -.964 | -2.759 | -.973 | -1.273 | -.481 | -1.493 | -1.699 | -2.862 |
| Asymp. Sig. (2-tailed) | .774 | .450 | .335 | .006 | .331 | .203 | .630 | .135 | .089 | .004 |
The Mann-Whitney U ranks shown in Table 4 show that in both cases where there were significant differences between pre and post score gains of STEM teachers and non-STEM teachers, the mean rank was higher for the pre and post score gains of STEM teachers than that of non-STEM teachers, with the mean rank for Set Up of 15.73 for STEM teachers compared with 6.08 for non-STEM teachers, and the mean rank for CAD/CAM of 31.86 for STEM teachers compared with 15.55 for non-STEM teachers.
Table 4
Mann-Whitney U Ranks
| Quiz Name | STEM Instructors vs Non-STEM Instructors | N | Mean Rank | Sum of Ranks |
| Wood | 1.00 | 88 | 50.81 | 4471.00 |
| 2.00 | 12 | 48.25 | 579.00 | |
| Total | 100 | |||
| Tolerances | 1.00 | 56 | 30.94 | 1732.50 |
| 2.00 | 6 | 36.75 | 220.50 | |
| Total | 62 | |||
| Fasteners | 1.00 | 137 | 76.01 | 10413.00 |
| 2.00 | 12 | 63.50 | 762.00 | |
| Total | 149 | |||
| Set Up | 1.00 | 20 | 15.73 | 314.50 |
| 2.00 | 6 | 6.08 | 36.50 | |
| Total | 26 | |||
| Scale Length | 1.00 | 63 | 32.00 | 2016.00 |
| 2.00 | 0a | .00 | .00 | |
| Total | 63 | |||
| Intonation | 1.00 | 37 | 21.26 | 786.50 |
| 2.00 | 6 | 26.58 | 159.50 | |
| Total | 43 | |||
| Guitar Necks | 1.00 | 27 | 14.00 | 378.00 |
| 2.00 | 0a | .00 | .00 | |
| Total | 27 | |||
| Geometry | 1.00 | 80 | 60.59 | 4847.50 |
| 2.00 | 35 | 52.07 | 1822.50 | |
| Total | 115 | |||
| Anatomy | 1.00 | 248 | 135.31 | 33556.50 |
| 2.00 | 23 | 143.46 | 3299.50 | |
| Total | 271 | |||
| Fret Spacing | 1.00 | 103 | 72.46 | 7463.00 |
| 2.00 | 35 | 60.80 | 2128.00 | |
| Total | 138 | |||
| Electronics | 1.00 | 160 | 88.83 | 14212.50 |
| 2.00 | 13 | 64.50 | 838.50 | |
| Total | 173 | |||
| CAD/CAM | 1.00 | 47 | 31.86 | 1497.50 |
| 2.00 | 10 | 15.55 | 155.50 | |
| Total | 57 |
Conclusions
Our findings comparing pre and post score gains between STEM teacher and non-STEM teachers yield encouraging results. The analysis indicates there were significant gains in students’ learning, but not statistically significant differences between STEM and non-STEM teachers in 10 of the 12 quizzes. This finding indicates that STEM and non-STEM teachers alike were equally successful in implementing technology-rich STEM content.
Only two of the quizzes measured—Set Up and CAD/CAM—STEM teachers were better than non-STEM teachers at producing student gains in the areas measured. It can, therefore, be concluded that with 50 hours of PD, STEM and non-STEM teachers were equally capable of implementing the grant’s curriculum, except where specialized pedagogical content knowledge is required. Additionally, the statistically significant increase in scores for each of the 12 MLAs measured across disciplines indicate that teachers from both STEM and non-STEM disciplines are able to implement and teach the grant’s PLB curriculum successfully, thus producing student gains between pre- and postassessments.
Implications
With less than 10% of all high school students taking an engineering technology course, few students are being prepared for well-paying, stable careers in the STEM workforce (Frase et al., 2016). Additionally, the gradual transition to the NGSS by implementing states necessitates teachers to find learning activities and experiences that incorporate SEPs alongside core science content. However, with many teachers only having experience in one or two STEM content areas, arts and humanities teachers being called upon to incorporate STEM, and with the number of preservice vocational teacher preparation programs decreasing, teaching integrated STEM concepts to meet these workforce demands can be challenging. The grant provides teachers with integrated STEM PD and, in turn, integrated STEM opportunities for K-16 students. These results show that with additional PD STEM and non-STEM teachers alike can provide instructional experiences that lead to statistically significant student learning gains.
Recommendations
This study and others support the use of PBL—in this case, through guitar building—as a vehicle to teach STEM. For teachers wishing to use the guitar as a vehicle to teach technology and integrated STEM, the 12 core MLAs are freely available to download at www.guitarbuilding.org through the grant’s forum. All teachers are encouraged to visit the website, participate in the forum, and implement these activities in their coursework.
These data show encouraging results for using the electric guitar as a vehicle to teach integrated STEM. Many connections can be made in a variety of STEM classes. Even if teachers are unable to have students build a guitar, the guitar could still be used to engage students in a STEM topic. For example, swirl dipping a guitar could be used as an example describing hydrophobic/hydrophylic molecules in chemistry. Physicals concepts include wave behavior, harmonics, frequency, electromagnetic induction of the pickups, and circuits. Biology concepts include the structure of the ear, hearing, and the decibel scale. Earth science concepts include investigating the environmental impacts of sourcing exotic woods for guitars.
Examples of math connections include fret spacing calculations, cost analysis of building a guitar, headstock geometry, and measurement units. Examples of technology connections include using spreadsheets to calculate the cost of building a guitar or to calculate the location of fret dots based on the scale length. Technology could also include safety components of tools, tool use and procedures, soldering, using an oscilloscope for intonation, different tuning devices and apps, using a soldering gun, and so forth. Possible engineering connections include using CAD to sketch the headstock design, the engineering design process, blueprint reading, constraints, using CNCs, discussing ergonomics of lab setup, and fasteners.
Limitations
While the data analyses yielded encouraging results, challenges arose with this exploratory study. The PD was widely advertised through a variety of venues, but more STEM teachers than non-STEM teachers participated. Teachers who sought the stipend were required to teach only two grant MLAs and corresponding pre- and postassessments, leading to asymmetrical representation of popular topics with insufficient data for others. For future studies, the team will consider assigning MLAs to instructors in order to ensure a complete set of data.
Another limitation to this study was the lack of a control group. For future studies, the team plans to include a control group in the research design. Additionally, while the study controlled for the content of the MLAs, instructors were allowed to select which MLAs to assign given their area of expertise—which resulted in varied instruction across the student sample. The pre- and postassessments were not validated, which is a limitation and an opportunity for future analysis. Additionally, some of the 12 quizzes, such as the example provided here, contain a high level of technical vocabulary and a lack of conceptual understanding. However, throughout the 12 quizzes, a combination of technical and conceptual concepts is assessed.
Suggestions for Future Work
The results of this study show that, after experiencing these PDs, STEM and non-STEM teachers alike were successful at implementing STEM-based MLAs in their classroom, as evidenced by positive student learning gains. Research also suggests that teachers need access to or to cultivate PD networks—otherwise known as communities of practice. The grant launched a new forum on www.guitarbuilding.org to encourage an ongoing dialogue between teachers and the grant team to pose questions, offer solutions, and provide support as teachers implement the curriculum. The effectiveness of offering such a community of practice will be the subject of future research.
Author Notes
The authors would like to thank the teachers participating in the STEM Guitar Faculty PD Institutes. We acknowledge partial funding, as well as activity trials for this study, for the following grants: Faculty Professional Development in Design, Construction, Assembly, and Analysis of a Solid Body Guitar Design (DUE 0903336), and LEAD with GUITARS in STEM (DUE 1304405).
References
Atkinson, R. (2013). A short and long-term solution to America’s STEM crisis [Web log post]. Retrieved from http://thehill.com/blogs/congress-blog/technology/287435-a-short-and-long-term-solution-to-americas-stem-crisis
Barlex, D. (Ed.). (2007). Design and technology: For the next generation: A collection of provocative pieces, written by experts in their field, to stimulate reflection and curriculum innovation. Steele Grange, UK: Cliffe & Company Ltd.
Bernstein, R., & Bernstein M. (2011). Turning STEM into STREAM: Writing as an essential component of science education. Retrieved from the National Writing Project website: https://www.nwp.org/cs/public/print/resource/3522
Burrows, A. C., Borowczak, M., Slater, T. F., & Haynes, J. C. (2012). Teaching computer science and engineering through robotics: Science and art form. Problems of Education in the 21st Century, 47, 6-15.
Burrows, A., & Slater, T. (2015). A proposed integrated STEM framework for contemporary teacher preparation. Teacher Education and Practice, 28(2-3), 318-330.
Casner-Lotto, J., & Barrington, L. (2006). Are they really ready to work: Employers perspectives on the knowledge and applied skills of new entrants to the 21st century U.S. workforce. Washington, DC: Partnership for 21st Century Skills.
Frase, K. G., Latanision, R. M., Pearson, G. (2016). Committee on engineering technology education in the United States. Washington, DC: National Academies Press.
Hauze, S., French, D., Castaneda-Emenaker, I., French, M., & Singer, T. (2017, January). Quantifying K12 and college student learning outcomes of STEM guitar building. Paper presented at the IEEE Integrated STEM Education Conference (ISEC), Princeton, NJ.
Heitin, L. (2012). Project-based learning helps at-risk students. Education Week, 31(29), 1-6.
Hmelo-Silver, C. E. (2004). Problem-based learning: What and how do students learn? Educational Psychology Review, 16(3), 235-265.
Hodges, C. B., Gale, J., & Meng, A. (2016). Teacher self-efficacy during the implementation of a problem-based science curriculum. Contemporary Issues in Technology & Teacher Education, 16(4), 434-451. Retrieved from https://citejournal.org/volume-16/issue-4-16/science/teacher-self-efficacy-during-the-implementation-of-a-problem-based-science-curriculum
Honey, M., Pearson, G., & Schweingruber, H. (2014). STEM integration in K-12 education: Status, prospects and an agenda for research. Washington, DC: National Research Council.
Jones, G. M., & Leagon, M. (2014). Science teacher attitudes and beliefs: Reforming practice. In N. G. Lederman & S. K. Abell (Eds.), Handbook of research on science education (Vol. 2; pp. 830-847). New York, NY: Routledge.
Kelly, B. (2012, April 27). What STEM is—and why we care [Web log post]. Retrieved from https://www.usnews.com/news/blogs/stem-education/2012/04/27/what-stem-is–and-why-we-care
Koro-Ljungberg, M., Yendol-Hoppey, D., Smith, J. J., & Hayes, S. B. (2009). (E)pistemological awareness, instantiation of methods, and uninformed methodological ambiguity in qualitative research projects. Educational Researcher, 38(9), 687-699.
Kuenzi, J. J. (2008). Science, technology, engineering, and mathematics (STEM) education: Background, federal policy, and legislative action. Congressional Research Services Reports, 35.
Litowitz, L. S. (2014). A curricular analysis of undergraduate technology & engineering teacher preparation programs in the United States. Journal of Technology Education, 25(2), 73-84.
Loucks-Horsley, S., Stiles, K. E., Mundry, S., Love, N., & Hewson, P. (2010). Designing professional development for teachers of science and mathematics, third edition. Thousand Oaks, CA: Corwin.
Mossuto, M. (2009). Problem-based learning: Student engagement, learning and contextualized problem-solving. Adelaide, AU: National Centre for Vocational Education Research.
National Research Council. (2012). A framework for K-12 science education: Practices, crosscutting concepts, and core ideas. Washington, D. C: The National Academies Press.
National Science Board. (2006). America’s pressing challenge — Building a stronger foundation. A companion to Science and Engineering Indicators 2006, 1, Retrieved from ERIC database. (ED490850)
NGSS Lead States. (2013). Next generation science standards: For states, by states. Washington, DC: The National Academies Press.
Tseng, K-H., Chang, C-C., Lou, S-J., Chen, W-P. (2013). Attitudes towards science, technology, engineering and mathematics (STEM) in a project-based learning (PjBL) environment. International Journal of Technology & Design Education, 23(1), 87-102.
Wei, R. C., Darling-Hammond, L., Andrew, A., Richardson, N., & Orphanos, S. (2009). Professional learning in the learning profession: A status report on teacher development in the U.S. and abroad. Oxford, OH: National Staff Development Council.
Appendix A
Modular Learning Activities Mapped to Common Core Curriculum Standards
| MLA | Curriculum Standard(s) |
| CAD/CAM | CCSS.Math.Content.HSF-IF.C.7e CCSS.Math.Content.HSF-LE.A.2 |
| Electronics | HS-PS3-3. CCSS.Math.Content.HSA.CED.A.2 |
| Fret Spacing | CCSS.Math.Content.HSA-SSE.A.1b CCSS.Math.Content.HSA-SSE.B.3c CCSS.Math.Content.HSA-REI.A.1 CCSS.Math.Content.HSA-REI.B.3 |
| Guitar Anatomy | CCSS.Math.Content.HSN-Q.A.2 CCSS.Math.Content.HSN-Q.A.3 |
| Guitar Geometry | CCSS.Math.Content.HSG.MG.A.1 CCSS.Math.Content.HSG.MG.A.3 CCSS.Math.Content.HSG.GPE.B.7 CCSS.Math.Content.7.G.A.1 CCSS.Math.Content.7.G.B.6 CCSS.Math.Practice.MP1 CCSS.Math.Practice.MP4 CCSS.Math.Practice.MP5 CCSS.Math.Practice.MP6 |
| Guitar Necks | HSS-ID.A.3 HSN.Q.A.1 HSN.Q.A.2 HSN.Q.A.3 HS-PS2-3. HS-ETS1-4. HS-LS2-2. HS-PS4-1. CCSS.Math.Content.HSN.Q.A.3 CCSS.Math.Content.HSA-SSE.A.1b CCSS.Math.Content.HSA-REI.A.1 CCSS.Math.Content.HSA-REI.B.3 |
| Intonation | CCSS.Math.Content.HSA-CED.A.4 CCSS.Math.Practice.MP1 CCSS.Math.Practice.MP4 CCSS.Math.Practice.MP5 CCSS.Math.Practice.MP6 |
| Scale Length | CCSS. Math.Content.HSN.Q.A.1 CCSS. Math.Content.HSN.Q.A.3 CCSS. Math.Practice.MP1 |
| Set Up | CCSS. Math.Practice.MP2 CCSS. Math.Practice.MP5 CCSS. Math.Practice.MP6 CCSS. Math.Practice.MP7 CCSS. Math.Content.HSG.GMD.B.4 |
| Threaded Fasteners | CCSS. Math.Content.HSN.Q.A.2 CCSS. Math.Content.HSN.Q.A.3 |
| Tolerances | CCSS.Math.Content.HSG.MG.A.1 CCSS.Math.Content.HSG.MG.A.3 CCSS.Math.Content.HSG.GPE.B.7 |
| Wood for Guitars | CCSS.Math.Content.7.G.A.1 CCSS.Math.Content.7.G.B.6 CCSS.Math.Practice.MP1 CCSS.Math.Practice.MP4 CCSS.Math.Practice.MP5 CCSS.Math.Practice.MP6 |
Appendix B
Fret Spacing PRE-ASSESSMENT
This assessment is to be taken before completing the Fret Spacing activity.
Student Institute ID__________________________
Faculty Institute ID__________________________
1. Who is the first known person to experiment with determining scalar intervals (Scale Lengths)?
a. Pythagoras
b. Galileo
c. Les Paul
d. Eddie Van Halen
e. None of these
2. Vincenzo Galilei was credited with developing the “rule of 18” in the 16th century.
a. True
b. False
3. The formula for calculating fret spacing is derived from the “rule of 18” and which of the following?
a. The quadratic formula
b. The twelfth root of 2
c. The Pythagorean theorem
d. Pi
e. All of these
4. A guitar’s scale length can be calculated by measuring the distance from the front edge of the nut to the center of the 12th fret, then doubling that measurement.
a. True
b. False
5. One of the most common scale lengths is the Fender 25-1/2” guitar scale.
a. True
b. False
6. Match each symbol in the fret calculation formula Dn = [(L – Dn-1) ÷ 17.817] + Dn-1 with what it represents from the options below labeled a trough e.
| _____ L _____ n _____ Dn _____ Dn-1 _____ 17.817 | a. Constant for calculating fret position b. Distance from nut to previous fret position c. Distance from nut to current fret position d. Scale length e. Fret position |
7. A guitar with a shorter scale length has a lower tension than a guitar with a longer scale length.
a. True
b. False
8. To implement the “rule of 18,” 16th century instrument makers would begin with which procedure?
a. Divide the string length by 2 (18 times)
b. Subtract 18 from the string length
c. Divide the string length by 2 to the 18th power
d. Divide the string length by 18
e. The “rule of 18” is just an expression and was never actually used to calculate fret spacing.
9. Select the correct equation to locate the 2nd fret on the neck of a 13.5″ scale length mandolin neck?
Formula: Dn = [(L – Dn-1) ÷ 17.817] + Dn-1
a. D2 = [(25.5 – 0) ÷ 17.817] + 0
b. D2 = [(13.5 – .76) ÷ 18] + 25.5
c. D2 = [(13.5 – .76) ÷ 17.817] + 13.5
d. D2 = [(13.5 -.76) ÷ 17.817] + .76
e. D2 = [(13 – .76) ÷ 18 + 0
10. The Gibson 24-3/4″ scale length rarely measures out to be 24-3/4″ because the scale length has gradually changed over the past 50+ years due to changes in production equipment.
a. True
b. False
![]()