Use of data is not new to schools, teachers, administrators, state education agencies, or parents. Indeed, data has been used by school administrators and teachers since schooling began; however, never has data literacy been as important as it is in the wake of the No Child Left Behind Act (NCLB, 2001) and the American Recovery and Reinvestment Act (2009). NCLB mandated teachers’ systematic analysis of data collected from standardized, state- or national-level assessments and use of the findings in their instructional decision making (Kennedy, 2011; Mandinach, 2012).
Data-driven decision making (D3M) is the systematic collection, analysis, and application of many forms of data from myriad sources in order to enhance student performance while addressing student learning needs (Marsh, Pane, & Hamilton, 2006). Dunn, Airola, Lo, and Garrison (2013) have added that for the classroom teacher, D3M requires identifying students’ strengths and weaknesses regarding learning objectives and taking this knowledge into the design of future instruction. D3M was included as one of the four pillars of the American Recovery and Reinvestment Act of 2009, reiterating an expectation that data and data use were to inform policy and practice.
Using data for accountability in developing, guiding, and sustaining organizational change in schools leading to improvements in student learning has been the focus of much research on systemic efforts to improve schools (Fullan & Steigelbauer, 1991; Massell, 1998; Schmoker, 2000). However, as of the mid-2000s, only a small amount of literature was available on the way teachers use data in instructional decision-making (Mandinach, Rivas, Light, Heinze & Honey, 2006; Moss, 2007). The earliest research on data supporting instruction was done in the mid-1980s (Mandinach, Honey, Light, Heinze, & Nudell, 2005; Popham, Cruse, Rankin, Sandifer, & Williams, 1985; Shepard, 1991), but systemic use of D3M has tended to be limited to administrative uses rather than focused at the classroom level.
Researchers have shown increasing interest in teacher use of various data in their instructional decisions (Mandinach & Jackson, 2012). Over the last few years, reports and case studies about data use have begun to appear at conferences and in the research literature; however, most of this literature has been about making data analysis less onerous or demanding (Hamilton, Stecher, & Klein, 2002; Mandinach et al, 2005; Spielvogel & Pasnik, 1999; Stringfield, Wayman & Yakimowski-Srebnick, 2005). Only recently has the interest in professional development (PD) for teachers on this topic gained momentum (Mandinach & Gummer, 2013).
As Earl and Katz (2002) noted, the use of data for school improvement is no longer a choice, yet issues still remain for its impact on practice for three primary reasons: timely availability of data, accessibility to data, and teacher understanding of how to use the data for classroom instruction or differentiated instruction. Timeliness is a key problem, as the results of state- and national-level assessments typically become available only after the relevant students have moved on to the next grade or school—making the data less than useful for the classroom teacher (Ikemoto & Marsh, 2007).
Even when the data are available, they are often inaccessible. Wayman (2005) noted that extensive data have been available to schools for many years, but this availability has not translated into “information richness” (p. 2) because of the way data are stored and accessed. Massell (2001) noted that most state and local accountability policies assume teachers know how to turn data into useful information; however, most teachers are not trained to do so (Mandinach & Gummer, 2013).
Finally, even when data are accessible to teachers, they often have difficulties in knowing what to do with it, due to the inadequacies of their PD around the source of the data or ways to use assessment data (Mandinach & Gummer, 2013; Wayman, 2005). Thus, D3M “continues to be a stress-inducing, learner-centered pedagogical paradigm shift for which most teachers are underprepared…” (Dunn et al., 2012, p. 88).
This paper presents a project that attempted to overcome these three problems through development of a data dashboard that provided teachers with immediate access to assessment information, including answers to questions and actions taken to arrive at the final responses.
This problem is compounded by the variety of data available in a typical school. Such school data includes attendance records, demographic data, special programs records, and grades, along with testing and assessment data for diagnostic purposes, including the results of high stakes testing. Analyzing and using these data to inform decisions is not intuitive for most administrators and teachers, which is why guidebooks (e.g., Holcomb, 2004, or Marsh et al., 2006) were written outlining the planning and implementation processes for using data to make decisions. These resources were written for administrators, not teachers, however.
An interesting framework for D3M was presented by Light, Wexler, and Heinze (2005), focusing on PD for teachers that uses student data for teaching and learning, rather than merely focusing on data analysis. Integrating work in the field of organization and management theory (Ackoff, 1989), management in business (Breiter, 2003), and government, politics, and economics (Drucker, 1989), Light et al. developed a conceptual framework linking data, information and knowledge. They noted that these factors are phases in the continuum from raw data to meaningful knowledge for decision making.
This framework demonstrates six steps used to garner knowledge from raw data: (a) collecting and (b) organizing data; (c) summarizing, (d) analyzing, and (e) synthesizing the data into information to be used in (f) decision-making. This process yields meaningful information that is contextualized by the interpreter for appropriate decisions within that environment. The process seems simple and logical enough, but operationalizing it within a classroom setting is critical. Even Light and colleagues (2005) acknowledged that the teacher’s knowledge of students, curriculum, and pedagogy is essential in using the knowledge gained through data analysis to aid in making pedagogical decisions.
This paper presents a case study of one National Science Foundation (NSF) funded project that included infusion of D3M principles and training into PD for participating teachers. Through this NSF-funded project, 12 teachers came together with researchers to create a participatory action research team. Here, the teachers were active members of the overall research team, helping the principal investigators understand how the student participants were making sense of and maneuvering within this NSF-funded project’s virtual assessment modules.
One major component of the project was to learn how to help teachers analyze student data that were generated by student actions within the virtual environment modules and, thus, turn raw data into contextualized knowledge that informs practice as intended by Light. We used Light et al.’s (2005) conceptual framework to build our discussion about our work with the project teachers. Specifically, the research questions guiding this paper were as follows:
- How can we help teachers understand and make sense of their student performance data from this project?
- How do teachers use these data to identify student scientific misunderstandings?
- Once scientific misunderstandings are identified, how do teachers plan to change their instructional strategies, if at all?
The Study
This study used immersive virtual environments to design new types of inquiry-based assessment modules to elicit middle school students’ understanding of science content and inquiry skills (Ketelhut, Nelson, Schifter, & Kim, 2013). Students can interact with nonplayer characters who introduce the mystery/problem of the module and often provide evidence that may be useful (see Figures 1, 2, and 3 for examples of the modules).
Students gather and record data, explore the environment, and observe visual signals and tacit clues about the problem they are investigating. There are two introductory modules and four assessment modules. The introductory modules acclimate students to the virtual world, related science tools, and problem-solving processes. The four assessment modules ask students to solve problems, contextualized in a narrative, that assess student understanding of various science concepts: adaptation, weather fronts, gas laws, and force vectors.
Students can use a portfolio of tools within the modules, called scitools, which change from module to module as appropriate for the topic. These could include a ruler, thermometer, pressure gauge, and scale (see Figures 1, 2, and 3 for examples of different scitools within three different modules). All scitools toolbars, which are app-like features, include a notepad for recording data and notes, help that is specific to the module, and a graphing tool.
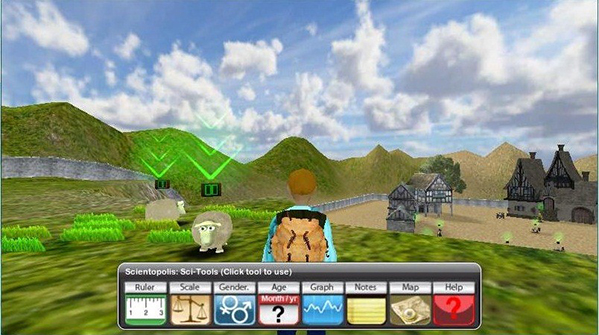 Figure 1. Sheep Trouble.
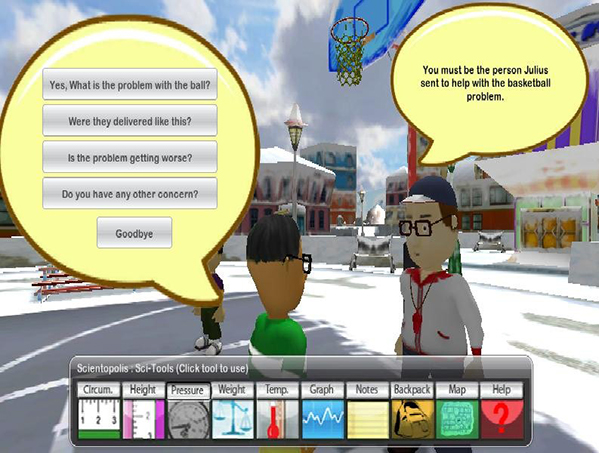 Figure 2. Basketball Trouble.
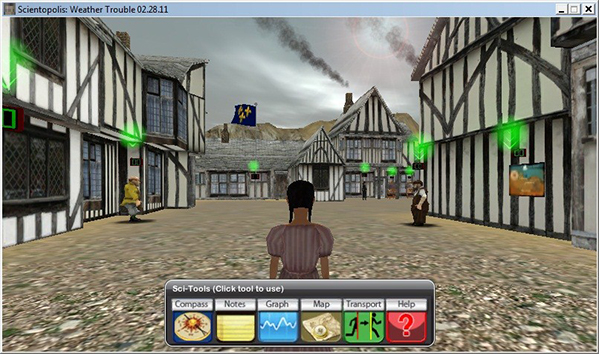 Figure 3. Weather data source examples.
Students can explore and gather data in their efforts to solve the posed problem, and when they are done they respond to a nonplayer character’s questions about the problem, supporting their inferences with the data they collected and ranking that data in importance for solving the problem. All actions and interactions by the students within the world are recorded and used to map the students’ inquiry behaviors as well as used to score their performance. Finally, for validation purposes, students are asked to answer a few multiple-choice questions drawn from various high-stakes district-, state-, or national-level tests that are related to the same topic but modified for the context of the module.
Tracking Student Performance Through the Project Dashboard
The NSF-funded project database collects student performance data, which are accessed via the project dashboard (see Figure 4). The dashboard is designed to serve both administrative, researcher, teacher, and student needs simultaneously. Of interest here is the teacher dashboard section, with the purpose to aid teachers’ tracking of student performance and obtain the necessary data to make informed decisions about their students’ learning. The dashboard enables teachers to view the overall performance of their students at a quick glance immediately after the assessment, as well as to be able to drill down deeper as their time and interest allowed.
Thus, the dashboard is an automated source for several of the steps in Light et al.’s (2005) framework for D3M for teachers, including (a) collecting, (b) organizing, and (c) summarizing data, thus providing information for teachers to perform the remaining three steps, which are (d) analyzing, and (e) synthesizing the data into information to be used in (f) decision-making.
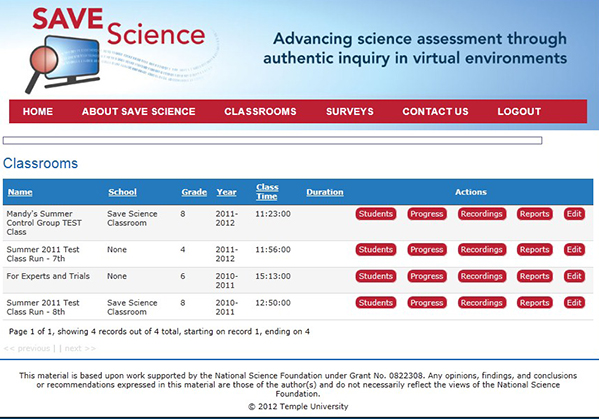 Figure 4. Teacher view of dashboard.
Immediately upon completion of a module, teachers (and researchers) can view (a) the students’ multiple-choice item answers (i.e., which response a student selects and which choice was deemed correct), open-ended responses, and the ranking of data collected in order of importance, (b) the characters and objects with which the students interacted in the virtual world, (c) the measurements that students took using the virtual scitools, and (d) the information they graphed. Another important feature is a map that shows, for individuals or classes, exactly what actions the students took in the module and in what order. The latter ability allows teachers to see class trends in students’ investigation techniques and, therefore, the scientific process.
Both teachers and researchers use the data management/progress monitoring tools to analyze simple student responses and complex student understanding data. The dashboard, therefore, puts all the data in an easy to access and use location. All of these data were analyzed by the researchers and teachers to capture student understanding of content and inquiry skills (Natarajan, Kirchgessner, & Ketelhut, 2012). Project teachers are encouraged to include the project data with students’ daily classroom work (i.e., projects, worksheets, teacher-made tests) to support and augment their own grading scheme beyond the purview of NSF-funded research interests.
D3M Professional Development
Nelson and Eddy (2008) suggested that teachers should work in collaborative groups to examine student work for planning future instruction. Further, they noted, this process works only when the collaborative group has mastered the required skills (p. 40). Such a collaborative teacher group process, coupled with the Light et al. (2005) framework, was the guide for the project’s PD. During 2009-2012, two different types of PD were held: training on using the project modules and instructional sessions based around science and data.
This paper focuses on the latter structures for which there were nine sessions, including a summer institute each year that lasted 1 to 3 days. The sequential nature of these PD sessions attempted to address Wayman’s (2005) assertion regarding a dearth of PD targeted toward mastering D3M skills for long-term implementation.
These sessions were split between understanding the science content and inquiry skills presented in the modules and understanding the data output from the modules. To accomplish the first, for a given project PD, experts in the content areas of one of the modules created inquiry-based instruction on the scientific constructs within the modules. The instruction was followed by opportunities for the teachers to work in small groups to develop new on-topic lesson plans for their own students, which they shared with their peers toward the end of the PD. These sessions also helped teachers understand the sources of data in relation to the module addressed.
The second theme for each summer institute was learning about the data accumulated in the project database. With this evolving theme, teachers alternately took on the role of colleague and learner. For example, in summer 2010, teachers were shown raw click data from the modules for each of their students. Working along with the principal investigators and project research team, the collaborative teacher group discussed what the data indicated, what data might not be useful, and what data should have been collected but was not.
In this first year, the teachers indicated that they would be interested in receiving both analyses along with raw data for their students. This discussion gave rise to the project dashboard. This session also initiated the concept behind a visual representation—heat mapping—of class data that evolved over the next 2 years.
The project dashboard, a result of previous teacher comments, was introduced in Year 3 of the project, and an emphasis was made on supporting teachers use the dashboard for administrative purposes, like enrolling students in the dashboard and indicating receipt of permission forms, which for some teachers presented a learning curve. One purpose of the dashboard was to achieve Steps 1 through 3 of the Light et al. (2005) framework: collecting, organizing, and summarizing the data from the virtual environment modules. Once teachers were comfortable with these steps, the student data aspects were introduced.
Next, the teachers worked in a collaborative group to achieve the final steps: analyzing, synthesizing, and decision making. Here, the teachers learned how to access whole-class reports showing how each student answered the objective-type items and the summative questions.
From this experience, the teachers noted it would be useful to have the dashboard indicate the specific question wording along with the correct answer so they could, at a glance, know how their students responded overall and on which item. Teachers could then drill down by individual student to access the extent of each student’s actions, which data they collected and in what order, whether they saved the data to the clipboard for future reference, whether they graphed any data to analyze the saved data, and then how they responded to the queries in the end. The whole set of data gave the teachers additional objective information about each student and how students approached, step by step, solving the problem.
The Using Data Workshop
A concerted attempt was made to help teachers interpret and use the data from the project dashboard with a D3M PD workshop during the last summer institute. The goal was to share an analysis of the student performance data, engage teachers in active conversations around that data, and develop a collaborative teacher working group using the data from the dashboard to create lesson plans incorporating student information in a manner responsive to the needs of particular students. The intention was to move toward the last three stages of the Light et al. (2005) framework—analyzing and synthesizing the data into information to be used in decision-making.
During this session, teachers were introduced to the principles of D3M and reminded of the types of data available through the dashboard. Careful analysis of item-level data helped teachers identify strengths and weaknesses in their students’ understanding of a concept. A few teachers stated that the approaches students took to making repeated measurements (as demonstrated through the heat maps of activity and other recordings from the dashboard) validated student learning processes. Others were surprised by some students’ lack of use of tools (e.g., graphing) or inability to put the pieces together, which was counter to their classroom observations of those students’ actions. One teacher noted that the dashboard data helped her see how and whether students honed in on the ideas or methods that were useful and on the right path. The trail of actions recorded by the dashboard provided irrefutable evidence of student actions toward answering the problem, which were unavailable through a paper and pencil test.
After analyzing that information, teachers began to generate solutions for improving their own instruction. The teachers as a group examined the student performance data from the dashboard, discussed their views on why students performed in certain ways within the modules, and assessed specific student misconceptions about scientific concepts. Using this information and working in small groups of three teachers each, they collaboratively discussed lesson plan options to address their instruction and specific student misunderstandings.
Using Data to Improve Classroom Instruction
As a culminating activity to complete Light et al’s framework for D3M, teachers shared with each other how they were addressing the apparent student misunderstandings identified by the project data analyses. Three of those lessons are included next, with indicated purposes and timing to address the noted misunderstandings. (Note: These are not lesson plans in the sense of having an objective, an introductory activity, specific instruction activities, and an assessment. Instead, they are examples of how each group of teachers thought they could address misconceptions.)
Lesson 1. Referencing that project data on student performance (particularly data showing weaknesses in student comprehension) correlated with year-long assessments of student progress, two teachers presented a lesson they have used to deepen inquiry skills and approach problem-solving effectively. The teachers used two techniques to reach this goal: (a) they developed a 10-question verbal summary survey with questions culled from those used in a module, and (b) they used an all-class, question-and-answer and discussion chaining methodology.
Teachers asked the whole class each question from the summary survey aloud after the module was completed, and in some cases, asked supplemental why questions about the correct answers, probing for more supporting evidence. Then, one student’s work was displayed on the screen at the front of the classroom (showing the heat maps of their activities and the measurements they took), and the class discussed how and why this example exemplified correct and thorough work. Both teachers noted that during the chaining, students explained to each other, which is effective and also mirrors the scientific inquiry process.
Lesson 2. After analyzing basketball module data on student information-gathering activities and contrasting those data with students’ rate of correct answers, two teachers presented a lesson they have used that aids students in making the leap from basic comprehension to generating hypotheses through building skills in note-taking. Both teachers noted that students in their classes had a range of capabilities, some with individual education plans, which impacted their experiences with the project modules.
One student on the autism spectrum, for example, took comprehensive and detailed notes on the clipboard tool while in the basketball module but was unable to make the connection between these notes and formulating a hypothesis about what was happening to the pressure in the basketball. Other students did the opposite and reached a conclusion or hypothesis without really engaging in recording measurements.
As a premodule lesson, these teachers focused on a note-taking technique that also helped test students’ background knowledge. They used a stepwise visual note-taking method. One line is drawn on the board on which students write their basic ideas about a concept, then a line is drawn above that on which students write ideas that connect to or stem from those basic concepts. A third line is then drawn above and students note conclusions or hypotheses reached based on the previous steps. The entire class engages in providing answers or ideas at each step, and only when one step is completed does the class move up to the next line and fill in answers.
The resulting material is a combination of information chunks, represented visually similar in format to what they will encounter in the module. Students ideally learn to build a hierarchy of knowledge in their minds through this process. Both teachers found this technique effective, particularly with students who collect lots of basic level pieces of information but do not tend to combine or analyze well.
Lesson 3. After synthesizing performance data from the weather module, which indicated students’ lack of understanding of causality, three teachers presented a lesson focused on improving students’ ability to use evidence to note valid cause-and-effect relationships. These teachers stated that much of what their students did with information and comparisons collected within the module appeared to be superficial. When challenged on why they chose their answer, students often said, “Because the data said to!”
The teachers suggested a lesson addressing the concept that data can prove an assertion to be incorrect. These teachers used a weather lore website to explore myths and sayings about weather (e.g., “red sky at night, sailor’s delight”) and then had students collect an actual data set on weather (times of sunset and sunrise in Anchorage, Alaska) and compared these data to the saying. Students then discussed the purposes of those sayings and myths. The teachers believed that students do not engage in higher order thinking at this age in the way the module (or other tests) may expect them to, and the lesson on reviewing data and causal relationships helped them think more clearly about the application of knowledge.
Discussion
Using data to drive instructional decisions in schools is now expected in public education. The key to successful use of D3M principles is helping teachers understand how to use disparate data to further understand their own students’ misunderstandings or misinterpretations, as evinced through test scores or experiential evidence (e.g., map of actions to solve a problem). Mandinach (2012) called this ability to use data to make informed pedagogical decisions “pedagogical data literacy” (p. 76). She emphasized that “effective data use requires going beyond the numbers and their statistical properties to make meaning of them” (p. 73), thus translating data into knowledge to inform instruction.
Swan (2009) noted, however, that this process requires multiple steps between forms of data and that teachers bring their knowledge of the classroom setting to this process. Teachers bring with them a wealth of knowledge of their students through observation data, teacher-made test data, project outcomes, and other products of learning to inform their practice. The task, then, becomes fitting the pieces of the puzzle together to understand how to inform practice going forward.
This project sought to provide scaffolding for the participating teachers to learn how to use D3M principles to support their students’ understanding of science inquiry and content. The scaffolding included an ongoing series of PD sessions focusing on the project module’s science content and on ways to view, analyze, synthesize, and make meaning from the data collected through the project dashboard.
Schifter (2008), in her assessment of several technology-related PD programs in one large urban school district, proposed a model for sustained change in teacher behaviors resulting from the PD. Two essential components were high quality PD and ongoing support, as demonstrated through this project. Through a collaborative effort, teachers designed lesson plans to provide differentiated instruction to their students, thus addressing student misunderstandings they identified through the analysis of the data. As stated by Dunn et al. (2012), “At the classroom level, [D3M] is a learner-centered teaching tool that supports differentiated instruction by providing information that helps teachers tailor instruction to fit both class and individual learning needs” (p. 88).
By building the necessary technological infrastructure to store and organize data (i.e., the dashboard), the project provided the required support and resources to teachers to make the data-driven discussions possible. During the PD, teachers extracted information on student performance and noted how students struggled with some underlying science concepts and specific inquiry skills. The collaborative teacher conversations led to the creation of a knowledge base of possible steps and lesson plans to address changes in instruction based on student learning needs. They also made instructional decisions they agreed to implement in their classrooms.
Since D3M is an iterative process about formative assessment, once teachers implement these lesson plans, they can begin to make further assessments and observe changes in their students’ performance. Swan (2009) pointed out,
As a rule of thumb, explicit knowledge consists of anything that can be documented, archived, and codified, often with the help of technology. A much harder concept to make visible is that of tacit knowledge, or implicit knowledge—the know-how contained in people’s heads. Often termed “the wisdom of practice,” tacit knowledge is difficult for even the expert to articulate. The challenge inherent with tacit knowledge is figuring out how to recognize, generate, share, and manage it. (p. 108)
Through the project PD component, these teachers learned how to use their tacit knowledge of their students, along with performance data from the project dashboard, to put the pieces of the puzzle together and make differentiated instructional decisions to support students learning scientific inquiry and content. This project is one example of taking the framework proposed by Light et al. (2005) and seeing teachers embrace D3M.
References
Ackoff, R.L. (1989). From data to wisdom. Journal of Applied Systems Analysis, 16, 3-9.
American Recovery and Reinvestment Act of 2009, Pub. L. No. 111-5. (2009). Retrieved from http://www.gpo.gov/fdsys/pkg/PLAW-111publ5/pdf/PLAW-111publ5.pdf
Breiter, A. (2003). Information – Knowledge – Sense-making: A theoretical analysis from management/business literature. Unpublished manuscript, Bremen, Germany.
Drucker, P.F. (1989). The new realities: In government and politics/In economics and business/In society and world view. New York, NY: Harper & Row.
Dunn, K., Airola, K., Lo, W., & Garrison, M. (2013). What teachers think about what they can do with data: Development and validation of the data driven decision-making efficacy and anxiety inventory. Contemporary Educational Psychology, 38(1), 87-98.
Earl, L., & Katz, S. (2002). Leading schools in a data-rich world. In K. Leithwood & P. Hallinger. (Eds.), Second international handbook of educational leadership and administration. (pp. 1003-1022). Dordrecht, Netherlands: Kluwer Academics.
Fullan, M., & Steigelbauer, S.M. (1991). The new meaning of educational change. (2nd ed.). Toronto, CA/New York, NY: Ontario Institute for Studies in Education/Teachers College Press, Teachers College, Columbia University.
Hamilton, L.S., Stecher, B.M., & Klein, S.P. (2002). Making sense of test-based accountability in education. Santa Monica, CA: Rand.
Holcomb, E.L. (2004). Getting excited about data (2nd ed.). Thousand Oaks, CA: Corwin Press.
Ikemoto, G. S., & Marsh, J. A. (2007). Cutting through the “data-drive” mantra: Different conceptions of data-driven decision making. Yearbook of the National Society for the Study of Education, 106(1), 105-131.
Kennedy, M. (2011). Data use by teachers: Productive improvement or panacea? Retrieved from the Michigan State University website: http://education.msu.edu/epc/documents/Kennedy-2011-Data-Use-by-Teachers.pdf
Ketelhut, D.J., Nelson, B., Schifter, C., & Kim, Y. (2013). Improving science assessments by situating them in a virtual environment. Education Sciences, 3(2), 172-192. doi:10.3390/educsci3020172
Light, D., Wexler, D.H., & Heinze, J. (2005, March). Keeping teachers in the center. A framework of data-driven decision-making. A paper presented at the annual meeting of the Society for Information Technology and Teacher Education, Phoenix, AZ.
Mandinach, E. B. (2012). A perfect time for data use: Using data-driven decision making to inform practice. Educational Psychologist, 47(2), 71-85. doi:10.1080/00461520.2012.667064
Mandinach, E.B., & Gummer, E. (2013). A systematic view of implementing data literacy in educator preparation. Educational Researcher, 42(1), 30-37. doi: 10.3102/0013189X12459803
Mandinach, E.B., Honey, M. Light, D., Heinze, C, & Nudell, H. (2005, April). Data-driven instructional decision-making using technology-based tools. Paper presented at the annual meeting of the American Educational Research Association, Montreal, Quebec.
Mandinach, E. B., & Jackson, S. S. (2012). Transforming teaching and learning through data-driven decision making. Thousand Oaks: CA: Corwin Press.
Mandinach, E.B., Rivas, L., Light, D., Heinze, C., & Honey, M. (2006, April). The impact of data-driven decision making tools on educational practice: A systems analysis of six school districts. Paper presented at the annual meeting of the American Educational Research Association, San Francisco, CA.
Marsh, J.A., Pane, J.F., & Hamilton, L.S. (2006). Making sense of data driven decision making in education. Santa Monica, CA: RAND Corporation.
Massell, D. (1998). State strategies for building capacity in education: Progress and continuing challenges (CPRE Research Report RR-41). Philadelphia, PA: University of Pennsylvania, Consortium for Policy Research in Education.
Massell, D. (2001). The theory and practice of using data to build capacity: State and local strategies and their effects. In S.H. Fuhrman (Ed.), From the Capitol to the classroom: Standards-based reform in the states. (pp. 148-169). Chicago, IL: University of Chicago Press.
Moss, P. (2007). Introduction: Evidence and decision making. In P. Moss (Ed.). Evidence and decision making, Vol. 106(1) (National Society for the Study of Education Yearbook; pp. 15-45). Malden, MA: Blackwell Publishing.
Natarajan, U., Kirchgessner, M.K., & Ketelhut, D.J. (2012). A design strategy for scaling up implementations in virtual environments. In Felicia, P. (Ed.), Proceedings of the 6th European Conference on Games Based Learning 2012 (pp. 640-644). Sonning Common, UK: Academic Conferences and Publishing Limited.
Nelson, M., & Eddy, R.M. (2008). Evaluative thinking and action in the classroom. New Directions for Evaluation, 2008(117), 37-46. doi:10.102/3v250
No Child Left Behind Act of 2001, Pub. Law No. 107-110. (2001). Retrieved from http://www.gpo.gov/fdsys/pkg/PLAW-107publ110/pdf/PLAW-107publ110.pdf
Popham, W.J., Cruse, K.L., Ranking, S.C., Sandifer, P.D., & Williams, R.L. (1985). Measure-driven instruction. Phi Delta Kappan, 66, 628-634.
Schifter, C.C.. (2008). Infusing technology into the classroom: Continuous practice improvement. Hershey, PA: Information Science Publishing.
Schmoker, M.J. (2000). The results we want. Educational Leadership, 57(5), 62-65.
Shepard, L. (1991). Will national tests improve student learning? (CSE Technical Report 342) Los Angeles, CA: Center for the Study of Evaluation, UCLA.
Spielvogel, B., & Pasnik, S. (1999). From the school room to the state house: Data warehouse solutions for informed decision-making in education. New York, NY: Center for Children and Technology.
Stringfield, S. Wayman, J.C., & Yakimowski-Srebnick, M.E. (2005). Scaling up data use in classrooms, schools, and districts. In C. Dede, J.P. Honan, & L.C. Peters (Eds.), Scaling up success: Lessons learned from the technology-based educational improvement (pp. 133-152). San Francisco, CA: Jossey-Bass.
Swan, G. (2009). Tools for data-driven decision making in teacher education: Designing a portal to conduct field observation inquiry. Journal of Computing in Teacher Education, 25(3), 107-113. doi:10.1080/10402454.2009.10784617
Wayman, J.C. (2005). Involving teachers in data-driven decision making: Using computer data systems to support teacher inquiry and reflection. Journal of Education for Students Placed at Risk, 10(3), 295-308. doi:10.1207/s15327671espr1003_5
Author Notes
This material is based upon work supported under National Science Foundation Grant No. 0822308/1157534.
Catherine C. Schifter
Temple University
Email: [email protected]
Uma Natarajan
University of Massachusetts, Boston
Email: [email protected]
Diane Jass Ketelhut
University of Maryland
Email: [email protected]
Amanda Kirchgessner
Temple University
Email: [email protected]
![]()