The National Center for Education Statistics reported in 2010 that nearly all classrooms in the United States have at least one computer with Internet access; yet, only 40% of teachers surveyed indicated that they frequently use computers in their instruction (Gray, Thomas, & Lewis, 2010). These findings are not surprising. Indeed, they are similar to those described by Cuban (2001) 10 years ago, who found that few teachers used computers in their regular instruction, despite increasing availability of computer access.
In spite of this apparent lack of growth in teacher technology integration over the last decade, interest in technology in the social studies classroom has increased, both as a pedagogical tool and as a subject of discussion in the classroom (Berson & Bolick, 2007; Martorella, 1997; Swan & Hofer, 2008; Whitworth & Berson, 2003). Previous studies indicate that although a number of potential benefits to integrating technology in the social studies are touted, teachers are limited in their actual use of the available tools.
Equipment availability has been identified as a potential factor impacting teachers’ instructional use of technology. In his 2006 study, Friedman found that, although most teachers expressed a positive reaction to the use of digital primary documents, their usage of this resource was largely dependent upon access to equipment, specifically an LCD projector. He also determined that technology training alone did not affect the rate with which digital documents were used, but rather how they were used. Teachers with access to equipment but lacking training tended to use digital primary sources as “show and tell” artifacts. Teachers who had training but lacked access to equipment did not use digital documents. Those teachers who had both access to equipment and training typically used the digital documents in student-centered learning situations or in a more constructivist manner.
The Internet is arguably the most widely available form of technology in U.S. classrooms. As such, the frequency and the manner in which teachers utilize the Internet is of interest. In a statewide survey of Indiana secondary social studies teachers, VanFossen (1999, 2001) found that although the teachers had access to the Internet few used it in their teaching to engage students in activities that required complex thinking. He argued that the lack of pedagogical Internet use may be linked with professional development that is ineffective in demonstrating how to use this resource in the social studies class.
In a replication of the 1999 study, VanFossen and Waterson (2008) found that many potential barriers to classroom Internet use had decreased in the intervening years between studies. However, the quantity, and perhaps more importantly, the quality of teacher Internet use was little changed. They suggested that the deficit in Internet use could be linked to teacher pedagogical beliefs and perhaps the influence of the testing demands from the No Child Left Behind Act (VanFossen & Waterson, 2008).
Several scholars have addressed the persistence of teacher beliefs and practice in their integration of instructional technology. In Oversold and Underused, Cuban (2001) examined the prediction that the technology integration would have a transformative impact on teaching, from teacher-centered to a constructivist, student-centered approach. He found that teachers did not alter their teaching style as a result of technology integration. Rather, if the teachers were using technology, they were using it in a manner supporting their existing teaching style.
Ertmer (2005) argued that the presence of or lack of technology integration that encourages student use is mediated by the teachers’ teaching philosophy and practice. If teachers value both a student-centered learning approach and the utilization of available technology, then their practice will reflect these beliefs. Ertmer’s premise is supported by her work with Ertmer, Ottenbreit-Leftwich, and York (2006-2007), in which they examined the perceptions and characteristics of exemplary technology-using teachers. They found that the strongest indicators of a teacher’s ability to utilize available technology effectively were intrinsic factors, such as beliefs and motivation.
Palak and Walls (2009) conducted a mixed methods study that sought to analyze the impact of teacher beliefs on their technology integration. They found that the availability of technology did not transform teacher instructional use to student-centered learning. Indeed, their findings are similar to Cuban’s (2001); if teachers use technology, they implement in a way that supports their existing behaviors.
In an effort to further understand teachers’ instructional use of technology, Mishra and Koehler (2006) discussed technology, pedagogy, and content knowledge (TPACK) as a theoretical construct to examine the instructional use of technology. TPACK builds upon the existing concept of pedagogical content knowledge (PCK), or “the ways of representing and formulating the subject that make it comprehensible to others” (Shulman, 1986, p. 9). According to Mishra and Koehler, a teacher’s understanding of how to use technology within the parameters of both teaching and content is key to how instructional technology is actually integrated. It is the intersection of a teacher’s technological knowledge, pedagogical knowledge, and content knowledge. The TPACK construct takes a teacher’s beliefs and teaching philosophy and places them within the context of a teacher’s knowledge of content and technology.
Although Koehler and Mishra (2008) described the interaction among these three factors as a “dynamic equilibrium,” they appeared to place heavy emphasis on the changing nature of technology and the impact that such change would have on the balance. The emphasis on the impact of technology change over content and pedagogy appears to have been overstated. Manfra and Hammond (2008-2009) critique the overemphasis of the impact of technology in the TPACK construct in their case study of two social studies teachers’ instructional choices with student-created digital documentaries. Over the course of their case studies, they found that the teachers’ pedagogical beliefs influenced the technology-related planned and enacted curriculum more so than did either content or technology knowledge.
Previous studies have suggested are several factors impact teachers’ instructional use of technology, including equipment availability, professional development, and teaching philosophy. This study examines middle grades social studies teachers’ technology integration in their classrooms. Teacher practice is a complex topic. To understand such practice, it is necessary to look past singular research methodologies and answers.
Much of the previous research in this field has focused on self-report data. As Swan and Hofer (2008) suggested, such self-report survey data cannot tell a complete picture. Respondents can misunderstand questions or misrepresent (either intentionally or not) their comfort and use of technology. Additionally, the nuances of teacher opinion, perspective, and experience are not accessible through surveys; qualitative methods are necessary to examine this information. This study utilizes a mixed methods approach to answer the following research questions.
- How do middle school social studies teachers at three suburban middle schools utilize technology in their teaching?
- What factors influence the teachers’ inclusion of digital technology in their teaching?
Methods
This study was conducted in two phases at three middle schools in a large western Florida school district. The first phase involved a survey of all social studies teachers at each of the three middle schools and a group interview of the participating teachers at each of the schools studied. The second phase included a series of 10 case studies of volunteer teachers. The case studies involved an individual interview, a classroom observation, and an analysis of teacher-provided documentary evidence.
Participants
The three schools, Palm Middle School, Ocean Middle School, and Citrus Middle School (all pseudonyms) were selected for their similarities in an effort to maintain consistency in student population, building infrastructure, and available technology. All three are suburban middle schools with similar socioeconomic demographics and were opened within a 4-year time frame (2000-2003).
Twenty-seven teachers participated in Phase 1 of this study, which included the completion of a survey and group interviews at each school. These 27 teachers included all of the social studies teachers at each of the three schools. Of the 27 teachers participating in Phase 1, 18 volunteered to participate in the second phase of the study. The 10 teachers selected for Phase 2 were from Palm and Ocean Middle Schools and taught only social studies during their day. Unfortunately, the 3 volunteers from Citrus Middle could not be included in the second phase of the study due to time constraints of the impending close of the academic year.
The remaining 8 volunteers either taught additional subject areas or asked to be removed from the study shortly after volunteering to participate. The 10 Phase 2 teachers were asked to participate in individual interviews, document collection, and classroom observations. Of the 10 participants, 8 completed all three components of Phase 2.
Instrumentation
All participating teachers completed a survey modified from VanFossen’s (2005) Internet Use Survey. This survey was utilized for two reasons. The Internet is the most readily available technology in schools, with nearly all teachers in the United States having a computer with Internet access in their classrooms (Gray et al., 2010). Also, the survey instrument is well grounded in the literature (Shiveley & VanFossen, 2009) and has been utilized in two previously published studies (VanFossen 1999, 2001; VanFossen & Waterson, 2008).
This instrument provides information regarding a teacher’s Internet usage, a teacher’s attitude toward Internet use in the classroom, and a teacher’s perception of environmental influences in using the Internet. Each type of Internet use was given a rating by an expert panel indicating task complexity, from lower order (1.0) to higher order (4.0), which was identified as an “Internet Use Score” (IUS; VanFossen & Waterson, 2008). The IUS was then used to ascertain the level of teacher Internet use by multiplying the teachers’ self-identified frequency ratings by the IUS weight. These weighted scores (IUS total score) were then used to delineate levels of teacher Internet use. Reliability estimates for the modified survey used in this study were tested using a test-retest measure, resulting in a mean percent agreement for the test-retests of 70%.
Procedures
Each of the school social studies department chairs arranged two before-school meetings during April and May 2008; the first meeting was to complete the Internet Use Survey and the second was to conduct a group interview. The semistructured group interviews (Merriam, 1998) with the participating teachers were conducted at each of the three schools. (See interview protocol in Appendix A.) The purpose of the group interview was to gather information not addressed in the Internet Use Survey, including the use of technology other than the Internet, specific information regarding barriers to use, examples of technology integration, and the participating teachers’ attitudes toward technology integration.
The 10 participants who volunteered for Phase 2 were asked to collect materials that they used in the classroom during the last month of the 2007-2008 school year. The course documents were collected in an attempt to ascertain the participant teacher’s teaching style, philosophy, and use of technology. Of the 10 teachers, 9 provided the requested course materials.
The Phase 2 individual interviews were formal and semistructured in organization (Merriam, 1998). In addition to demographic items, questions for the individual interview were modified from Franklin and Molebash’s (2007) survey distributed to elementary teachers (Appendix B). The teachers were asked to review the interview transcript, make necessary changes, and then return the document to the researcher. This exchange served as a member check for the interview, providing the participating teachers an opportunity to clarify their statements.
Nine of the teachers participated in a classroom observation; 1 teacher moved out of the area prior to being observed. The teachers were asked to identify dates when they would be using technology in a manner typical of their technology use. The teachers were observed for one class period. The data from the observations were then triangulated with the data collected from the document analysis and the individual interview to capture a comprehensive picture of the teachers’ teaching practices and technology integration.
As a mixed-methods study, data collected were both quantitative and qualitative. Quantitative data collected in the first phase of the study through the survey instrument were analyzed using descriptive statistics. With a sample size of 27 participants (n = 27), the information from this study cannot be generalized to a larger population; therefore, statistical measures that suggest generalization are inappropriate.
Data were analyzed using descriptive statistics and the constant comparison method (Glaser, 1965). For the analysis of the qualitative data, several a priori themes were derived from a review of the literature. These themes included attitude toward technology, teaching philosophy, environmental influences, and instructional strategies. Themes were added and revised throughout data collection and analysis (as recommended by Merriam, 1998). Following an initial comprehensive review of the qualitative data, the themes were modified to barriers, attitude toward and comfort with technology, and teaching and learning (Appendix C). These three themes were then used in the further analysis of the data. Within these themes additional categories emerged during data analysis. To ensure reliability in data coding, a second researcher was asked to code multiple sections of the interview transcripts, which resulted in a 91.67% interrater agreement.
Results
This study utilized a mixed-methods research protocol, incorporating both quantitative and qualitative analyses in an effort to answer the questions guiding this study (Creswell & Plano Clark, 2007; Onwuegbuzie & Leech, 2005; Tashakkori & Teddlie, 1998). Due to the quantity of data collected in this mixed-methods study and the use of a number of data sources to answer the research questions, data from the Internet Use Survey, the group interviews, and individual case studies are presented in the following separate sections.
Internet Use Survey Data
Demographic data. Of the 27 teachers participating in Phase 1 of this study (Table 1), 11 were from Palm Middle School, 10 were from Ocean Middle School, and 6 were from Citrus Middle School. Eight of the participants (29.62%) were male and 19 (70.37%) were female. Twelve participants (44.44%) had earned a bachelor’s degree, 14 (51.85%) had earned a master’s degree, and 1 (3.70%) had earned a specialist in education degree. The participants’ ages ranged from 25 years to over 60 years. The average teaching experience was 12.73 years, with a range of 3 to 38 years. Seven (25.93%) of the teachers taught sixth-grade World Geography, 10 (37.04%) taught seventh-grade World Geography, 9 (33.33%) taught eighth-grade U.S. History, and 1 teacher (3.70%) taught both seventh-grade World Geography and eighth-grade U.S. History. The teachers reported participating in a mean of 6.63 hours of technology-related professional development training, ranging from no training to 20 hours.
Table 1
Demographic and Professional Characteristics of Participants
Characteristic | Frequency | Percent |
| Gender | ||
| Male | 8 | 29.62 |
| Female | 19 | 70.37 |
| Degree Earned | ||
| Bachelors | 12 | 44.44 |
| Masters | 14 | 51.85 |
| Specialist | 1 | 3.70 |
| Doctorate | 0 | 0 |
| Other | 0 | 0 |
| Age | ||
| 24 years or younger | 0 | 0 |
| 25-29 years | 5 | 18.52 |
| 30-34 years | 3 | 11.11 |
| 35-39 years | 5 | 18.52 |
| 40-44 years | 4 | 14.81 |
| 45-49 years | 1 | 3.70 |
| 50-54 years | 3 | 11.11 |
| 55-59 years | 5 | 18.52 |
| 60 years or older | 1 | 3.70 |
| Teaching Experience | ||
| 1-10 years | 16 | 61.54 |
| 11-20 years | 5 | 19.23 |
| 21-30 years | 1 | 3.85 |
| 31 years or more | 4 | 15.38 |
| Course(s) Taught | ||
| 6th grade Geography | 7 | 25.93 |
| 7th grade Geography | 10 | 37.04 |
| 8th grade U.S. History | 9 | 33.33 |
| 7th grade Geography & 8th grade U.S. History | 1 | 3.70 |
| Technology Training (number of hours) | ||
| No training | 5 | 19.23 |
| 1-5 hours | 8 | 30.77 |
| 6-10 hours | 10 | 38.46 |
| 11-15 hours | 2 | 7.69 |
| 16-20 hours | 2 | 7.69 |
| Note. N = 27 | ||
Available technology: Use and comfort. High speed Internet access was reported in all classrooms. All but two teachers reported having access to LCD projectors. Eighteen (66.67%) of the participant teachers had a projector located permanently in their rooms. Multiple laptop carts were available for use at all three schools.
Participants were asked to report on the amount of time they spent using the computer at school and home. The teachers reported spending an average of 10.56 hours per week at school using a computer, with a range of 2 to 20 hours, and an average of 11.37 hours per week at home, with a range of 0 to 20 hours. Of the 27 teachers surveyed, all but one reported having home Internet access.
All participants reported using the Internet for both professional and personal use. Personal Internet use was reported at a higher frequency than was professional use; 17 (62.96%) of the participants reported using the Internet nine or more times per week for personal reasons, as compared to 6 (22.22%) teachers using the Internet at a similar rate for professional reasons.
Participating teachers reported frequent use of word processing software. Twenty-four of the 27 teachers (88.89%) used word processing software five or more times a week. Conversely, the teachers reported infrequent use of spreadsheet software with 85.19% (n = 23) using spreadsheets fewer than three times per week; 11 teachers (40.74%) reported never using spreadsheet software. Results similar to those of spreadsheet software use were reported for the participants’ use of productivity, web publishing, and FTP (file sharing) software. Seventeen teachers (62.96%) reported never using productivity software; 24 (88.89%) reported never using web publishing software; and 21 (77.78%) reported never using FTP software. Although not as frequently reported as word processing use, 21 (77.77%) reported using presentation software at least one or more times per week.
To ascertain the participating teachers’ comfort with software applications, they were asked to respond to several items using a 4-point Likert scale of 1 = uncomfortable, 2 = somewhat comfortable, 3 = moderately comfortable, and 4 = very comfortable. All teachers surveyed reported being very comfortable using word processing software (M = 4.0). The teachers indicated being moderately to very comfortable with presentation software (M = 3.41), somewhat to moderately comfortable with spreadsheet software (M = 2.93), and somewhat comfortable with productivity software (M = 2.15). The data indicate that the participants were uncomfortable using Web publishing software (M = 1.85) and FTP software (M = 1.85).
Internet Use: Frequency. The participants most frequently used the Internet for information gathering (Table 2), a similar result to that found by VanFossen and Waterson (2008). The five most-frequent uses, as determined by the respondents mean Internet use, included gathering background information(M = 3.44), gathering multimedia (M = 3.33), encouraging students to gather background information, searching for lesson plans (M = 3.07), and accessing primary source material (M = 2.96).
Participants reported rarely using the Internet to encourage student communication outside the classroom. Students were not encouraged to communicate using email (M = 1.81), nor to develop webpages (M = 1.30). Teachers rarely utilized webquests (M=1.78), nor did they have the students analyze webpages for bias (M = 1.48) or compare and contrast websites from different points of view (M = 1.67). The mean use scores for the remaining six Internet activities ranged from the infrequent, developing a webpage for courses taught (M = 2.04), to the nearly frequent, contacting other social studies teachers (M = 2.85).
Table 2
Classroom Internet Use Frequency Distribution (in percentages)
Type of Internet Use | IUS Weight | Never | Rarely | Occasionally | Frequently | Mean | SD |
| A. Gather background information for lessons you teach | 1.0 | 0 | 14.81 | 25.93 | 59.26 | 3.44 | .751 |
| B. Gather multimedia for use in lessons you teach | 2.0 | 0 | 18.52 | 29.63 | 51.85 | 3.33 | .784 |
| C. Encourage students to use the Internet to gather background information | 2.0 | 0 | 19.23 | 42.31 | 38.46 | 3.19 | .749 |
| D. Encourage students to use e-mail to contact other students or content experts | 2.0 | 55.56 | 18.52 | 14.81 | 11.11 | 1.81 | 1.08 |
| E. Take students on a “virtual fieldtrip” using the Internet | 3.0 | 33.33 | 25.96 | 29.63 | 11.11 | 2.19 | 1.04 |
| F. Develop interactive lessons that requires students to use the Internet to complete some take or assignment | 4.0 | 11.11 | 48.15 | 37.04 | 3.70 | 2.33 | .734 |
| G. Encourage students to develop WebPages for an assignment | 3.0 | 77.78 | 14.81 | 7.41 | 0 | 1.30 | .609 |
| H. Develop WebPages for social studies classes you teach | 3.0 | 44.44 | 25.93 | 11.11 | 18.52 | 2.04 | 1.16 |
| I. Have students complete inquiry-oriented WebQuests | 4.0 | 48.15 | 29.63 | 18.52 | 3.70 | 1.78 | .892 |
| J. Access primary source materials for use in your classroom | 3.0 | 7.41 | 25.93 | 29.63 | 11.11 | 2.96 | .980 |
| K. Search for lesson plans for particular classes you teach | 1.0 | 0 | 29.63 | 33.33 | 37.04 | 3.07 | .829 |
| L. Access digital video clips to use in your classroom | 1.0 | 14.81 | 44.44 | 29.63 | 11.11 | 2.37 | .884 |
| M. Contact other social studies teachers for professional development or lesson ideas | 2.0 | 3.70 | 25.93 | 51.85 | 18.52 | 2.85 | .770 |
| N. Have students complete specific worksheet activities use the Internet as a resource | 1.0 | 25.93 | 44.44 | 25.93 | 3.70 | 2.07 | .829 |
| O. Have students analyze webpages for accuracy or bias | 4.0 | 62.96 | 25.93 | 11.11 | 0 | 1.48 | .700 |
| P. Have students compare/contrast information from websites with different points of view | 4.0 | 48.15 | 37.04 | 14.81 | 0 | 1.67 | .734 |
The participating teachers were classified as high-level users, mid-level users, or low-level users of the Internet using the two methods employed in VanFossen (1999) and VanFossen and Waterson (2008). (See Table 3.) Teachers were categorized by their Internet use mean scores (Muse), using the parameters outlined in VanFossen (1999): high-level users are those whose mean score ranged from 2.75 to 4.0; mid-level users are those whose mean score ranged from 2.0 to 2.74; and low-level users are those whose mean score ranged from 1.0 to 1.9. Using these parameters, 7 teachers (25.93%) were identified as high-level users, 14 (51.85%) were mid-level users, and 6 (22.22%) were low-level users. These results resemble the quartiles identified in the VanFossen (1999) study.
Table 3
Teacher Internet Use Level: Mean use, IUS, and Self-Reported Ratings
Participant | Muse | IUS (Rate) | Self-Reported Rate |
| 1.1 (Buckley) | 3.0 (High) | 114 (High) | Mid |
| 1.2 (Smith) | 2.19 (Mid) | 83 (High) | High |
| 1.3 (Norris) | 2.06 (Mid) | 81 (High) | Low |
| 1.4 (Stephens) | 2.81 (High) | 111 (High) | High |
| 1.5 (Adams) | 1.81 (Low) | 66 (Mid) | Low |
| 2.1 | 1.5 (Low) | 101 (High) | Mid |
| 2.2 | 3.38 (High) | 129 (High) | High |
| 2.3 | 2.0 (Mid) | 70 (Mid) | Mid |
| 2.4 | 2.5 (Mid) | 96 (High) | Mid |
| 2.5 | 2.13 (Mid) | 79 (Mid) | High |
| 3.1 | 2.5 (Mid) | 94 (High) | Mid |
| 3.2 (Hill) | 2.94 (High) | 110 (High) | High |
| 3.3 (Alexander) | 2.0 (Mid) | 69 (Mid) | High |
| 3.4 | 1.94 (Low) | 68 (Mid) | Mid |
| 3.5 (Edge) | 3.13 (High) | 115 (High) | High |
| 4.1 | 1.75 (Low) | 61 (Mid) | Low |
| 4.2 | 2.44 (Mid) | 88 (High) | Mid |
| 4.3 | 1.63 (Low) | 63 (Mid) | Low |
| 4.4 | 2.38 (Mid) | 98 (High) | High |
| 4.5 | 1.63 (Low) | 56 (Low) | Low |
| 4.6 | 2.13 (Mid) | 77 (Mid) | Mid |
| 5.1 | 2.0 (Mid) | 74 (Mid) | High |
| 5.2 | 2.5 (Mid) | 86 (High) | High |
| 5.3 | 2.25 (Mid) | 82 (High) | Mid |
| 5.4 | 2.88 (High) | 112 (High) | High |
| 5.5 | 2.13 (Mid) | 75 (Mid) | Mid |
| 5.6 | 2.94 (High) | 110 (High) | High |
| Note. Muse determined by calculating the individual’s reported mean of Internet use from Question 9; rate determined as described in VanFossen (1999). IUS is a summation of individual’s reported frequency multiplied by the weighted score provided in Table 1; rate determined as described in VanFossen & Waterson (2008). Self-reported levels are as reported in survey Question 22. | |||
The participant’s Internet use was categorized a second time, using the IUS described in VanFossen and Waterson (2008). High-level users were identified as having an IUS greater than or equal to 80, mid-level users as having an IUS between 60 and 79, and low-level users as having an IUS less than or equal to 59. Using the IUS score parameters, 16 teachers (59.26%) were identified as high-level users, 10 teachers (37.04%) were identified as mid-level users, and 1 teacher was identified as a low-level user. Of the 27 participating teachers, 13 (48.15%) had an increase in their level of Internet use when the rates were calculated using the IUS. Indeed, one teacher moved from a low-level user, as determined by the Muse, to a high-level user as determined by the IUS. These increases suggest that the quality of Internet use, as determined by the IUS value, was more influential to the user’s classification than the frequency with which the Internet was used.
Teachers were also asked to self-evaluate their level of Internet use. As is shown in column 3, 12 of the 27 participants (44.44%) identified themselves as high-level users, 10 (37.04%) as mid-level users, and 5 (18.52%) as low-level users. When compared with their levels as identified by both the Muse and IUS, 21 (77.77%) accurately identified their level of use, as determined by at least one of the two calculated ratings. Of the remaining 6 teachers, 3 underestimated their level of Internet use and 3 overestimated their level of use.
As a follow up to their frequency self-assessment, the teachers were asked about their desire to use the Internet in the classroom. Twenty-two of the 27 teachers (81.47%) reported a desire to use the Internet more often or much more often than their current practice. Four teachers indicated that they used the Internet as much as they cared to, and 1 teacher reported using the Internet less often than in previous years.
Internet Use: Teacher attitudes. In addition to measuring the frequency with which they used the Internet, participants were asked to reflect on their attitudes toward using the Internet in the classroom, as indicated by the level of importance they gave the 16 teaching activities. Teachers were asked to rate the importance of the activities using a 4-point Likert scale (1 = not an important teaching tool/activity, 2 = a somewhat important teaching tool/activity, 3 = an important teaching tool/activity, and 4 = a very important teaching tool/activity).
The participants rated information gathering activities highest among the Internet activities (Appendix D): accessing primary source material (M = 3.65), gathering multimedia for lessons (M = 3.62), encouraging students to gather information (M = 3.54), and gathering background information for lessons (M = 3.50). The teachers’ responses indicated that they viewed encouraging students to use email (M = 2.24) and encouraging students to develop webpages (M = 2.27) as being only somewhat important activities. These results are similar to the teachers’ frequency of use, where information gathering was the most frequent and using the Internet as a tool for outside student communication (email and WebPages) was infrequent.
Of interest was the apparent disconnect between the teachers’ perceived importance of requiring students to analyze webpages and the frequency with which teachers employed this activity. Analyzing websites for bias and accuracy was deemed at least somewhat important by over 92% of the surveyed teachers (M = 2.81), yet teachers reported that they rarely engaged their students in such analysis (M = 1.48). Similarly, over 96% of the surveyed teachers rated comparing and contrasting websites with different points of view as at least somewhat important, but they rarely asked their students to do this task (M = 1.67).
Relationship among variables. In an effort to determine the relationships among the factors associated with classroom Internet use and technology integration, the intercorrelations among variables were computed. The following variables were used in the correlation analysis: Internet use mean score, IUS software use mean, self-reported technology use, comfort with software applications, technology training, LCD availability, computer availability, degree earned, teaching experience, age, and attitude toward Internet mean score (Appendix E). A statistically significant and strong correlation was found between Meanuse and IUS (rs = .86, p < .01) indicating that although not a perfect correlation the two methods for assessing teachers’ frequency of Internet use are strongly associated. Statistically significant but moderate correlations were found among six pairings: Meanuse and self-reported use, Meanuse and comfort with software applications, Meanuse and mean of attitude toward Internet use, IUS and self-reported use, IUS and comfort with software applications, and teaching experience and teacher age. The correlation between age and teaching experience is not considered informative. Statistically significant yet weak correlation was present between self-reported and both comfort with software applications (rs = .45, p < .05), and attitude toward Internet use (rs = .42, p < .05).
Perhaps the most interesting results from the correlation analysis are the relationships that were not significant. Contrary to Friedman’s (2006) argument, there was no apparent relationship between technology availability (LCD availability, computer availability) and the various measures of Internet use, teacher comfort, and teacher attitude. Similarly, neither technology training nor degree earned appeared to have a significant relationship with teachers’ Internet use, comfort, or attitude. As was found in previous studies (Cuban, 2001; VanFossen & Waterson, 2008) teacher experience did not appear to have a relationship with these three indicies.
Group Interviews
Semistructured group interviews with the participating teachers were conducted at each of the three school sites during before-school department meetings. The group interviews were designed to gather information not addressed in the Internet Use Survey, such as use of technology other than the Internet, specific information regarding barriers to use, examples of technology integration, and the participating teachers’ attitudes toward technology integration. As this was a semistructured interview, questions were modified during the course of the interview to capture additional information.
An analysis of the group interview frequency data indicates that the most-often discussed topic was that of equipment-related barriers to technology integration. Four codes describing equipment barriers (access to equipment, functionality of equipment, age of equipment, and lack of equipment) were mentioned 52 separate times over the course of the three group interviews. This rate constitutes 64.20% of the codes associated with barriers and nearly a quarter (23.60%) of all items discussed in the interviews. Barriers related to administrative policy were also frequently discussed; district administrative policies, school administrative policies, high-stakes testing impacts, and firewall issues were mentioned a combined 32 times, or 39.51% of the barrier-associated items.
Over one quarter of the items discussed during the interview related to teacher and student technology use. However, of the 54 instances of technology use codes, 40 (or 74.07%) related to teacher use of technology, and 14 (or 25.93%) involved student technology use. Under the theme of attitude and comfort with technology, the teachers most often mentioned their own or colleagues discomfort with technology. Technology-related professional development was also a concern for the participating teachers.
Palm Middle School. Seven teachers at Palm Middle School participated in a group interview held in the department chair’s classroom. The teachers were asked questions regarding their understanding of student learning, their use of technology with students, and barriers to their technology integration.
The teachers interviewed at Palm Middle School identified active learning strategies as being the most effective way of encouraging student learning in the middle grades. The consensus from the 7 teachers can be summarized by the following quote from Ms. Carroll (all names are pseudonyms): “At this grade level I think they learn hands on, where they are participating in an activity other than listening or reading.”
The most commonly used classroom technology was the Internet, for both information gathering and teacher communication. The Internet-based information was used as research for other projects or as an aid to classroom instruction. Student use of technology was identified, specifically in doing research for a project, or in the use of presentation software. However, the teachers more frequently described their own use of technology.
When questioned about the factors influencing their technology integration, the first response was “equipment availability.” The functioning laptop carts at Palm Middle School are housed in the school’s media center, which is often difficult to access, as the media center is the school’s only large meeting space. Equipment availability and functionality has become such an issue that several of the teachers have purchased their own for use in the classroom.
Two additional barriers to technology integration were discussed in the interview. Ms. Roberts voiced the following opinion about how the state’s high-stakes testing had affected her technology use. “If you want to do FCAT explorer – that’s great. But if you want to do anything else, there is no interest or support.” FCAT explorer is the Florida Department of Education sponsored test practice site for students to prepare for the Florida Comprehensive Assessment Test. A second issue, vocalized by Ms. Carroll, was her own comfort with technology and the lack of available options for help. “I want to do a PowerPoint with hyperlinks and some music in… The people that are resources are overloaded. And some of us are less technical than others.”
Overall, the teachers who participated in the Palm Middle School group interview saw technology integration as beneficial to their own teaching and for their students learning. However, they identified multiple barriers prohibiting them from maximizing the potential benefits of technology. Those barriers included equipment availability, equipment functionality, high-stakes testing, and teacher comfort (or discomfort) with technology.
Ocean Middle School. Seven teachers from Ocean Middle School participated in a group interview held in the classroom of one of the participants. Similar to the teachers at Palm Middle School, the teachers at Ocean Middle School identified active learning strategies as being the most effective for students in the middle grades. The teachers reported use of LCD projectors, interactive whiteboards, presentation software, and document cameras. One teacher, Mr. Stephens, also indicated that he uses digital cameras, flash drives, digital portfolios, and digital filmmaking in his classroom. The most frequently identified use of technology in the Ocean Middle School interview was the teachers’ use of an LCD projector to project presentations and websites.
The majority of the interview addressed the barriers the teachers perceived as inhibiting their technology integration. The number one concern of all the participating teachers was equipment, both access and functionality. Their concern is typified by Ms. Dennis, who commented, “I know a lot of my team would like to [use technology]. But you have to check it [the LCD projector] out and return it that same day. They just don’t feel like going down every day and checking it out.” The teachers at Ocean Middle School identified access to the technology as a major impediment to their technology integration. Indeed, due to perceived restrictions to equipment access, one of the teachers in the interview purchased her own laptop, document camera, and LCD projector. Several others had purchased a laptop to use in class.
Unlike Palm Middle School, Ocean Middle School had six portable laptop carts with wireless Internet and wireless laser printing for checkout from the media center. The majority of the computers in the six carts functioned; however, their full functionality was a concern expressed by multiple teachers in the interview. When discussing the computers in her classroom, Ms. Smith expressed the following frustration. “I had a student come in and plug in a jump drive into one of the laptops and his jump drive is so advanced that the computer wouldn’t even load it.” Mr. Charles best described the sentiments of the teachers in the interview.
What comes to mind is the quote that I’ve run across several times …. “Our job is to prepare students for their futures, not to prepare students for our lives.” Frankly, that’s kind of what we are doing. We are working with 20th century technology and trying to prepare them for the 2020s.
The teachers at Ocean Middle School are not lacking equipment. However, they are faced with problems inherent in technology, functionality, and compatibility.
In addition to concerns over access and functionality, several teachers expressed concern about their own ability to use the available technology. Ms. Gonzalez stated that she felt “somewhat intimidated because I would have computer problems, and Mr. Stephens would send the kids over to help me with it. And whereas I’m grateful that they came over and fixed it, I don’t know where to go to learn more.” A final barrier identified during the Ocean Middle School group interview was the impact that standardized testing has had on the ability to integrate technology into the classroom. Ms. Taylor explained their predicament. “When you do things that are more project-based learning or you’re trying to put things in more multimedia, it’s harder to measure, and it’s harder to prove to an administrator.”
The teachers at Ocean Middle School saw the value of using technology in the classroom, but they faced barriers that they perceived as inhibiting their technology integration. Although they had equipment, unlike Palm Middle School, the teachers still felt that there were equipment barriers impeding their use of technology. The barrier most often described and precipitating the most vehement reaction was equipment functionality, or a lack of functionality. Also of concern for these teachers was access to equipment, their own comfort with technology, and the impact that standardized tests had on student use of technology.
Citrus Middle School. Four teachers at Citrus Middle School participated in a group interview held in the department chair’s classroom. The interview participants generally agreed that students need learning environments that require them to manipulate content. Each of the teachers mentioned students’ need to “work with” content—in other words, they advocated active learning as most effective for student learning in the middle grades.
All of the teachers in the group interview mentioned using an LCD projector or an interactive whiteboard on a daily basis. When asked about the availability of projectors at Citrus Middle School, Mr. Brady stated that “everyone who wants one” has a projector. The teachers reported that the school had seven portable laptop carts, each with a minimum of 12 functioning laptops, available for checkout. Although equipment appeared to be readily available at Citrus Middle School, Mr. Brady purchased his own projector, laptop, and Bluetooth tablet to ensure that he had daily access to equipment.
Unlike the two prior schools, where access was of major concern, the teachers at Citrus Middle School were more concerned with compatibility issues and the district firewall. All four teachers expressed a frustration with the restrictiveness of the district Internet firewall. While all acknowledged a need for the security, they questioned whether the firewall could differentiate between student and teacher log-ins. “For teachers—give us a little more access….Students could have one, teachers could have another” (Ms. Castor).
Technology professional development was another frustration for these teachers. All four identified themselves as regular users of technology. They found that the professional development offered by the school district was inappropriate for their needs. “I think they focus too much on Word and PowerPoint and picture taking, rather than things we can actually use,” Ms. Castor said. Mr. Brady concurred that “most of the trainings are for the reluctant computer user who hasn’t really done much of anything to this point and they are just starting to learn.”
Despite their frustrations, all four teachers viewed technology as being beneficial to their students. Mr. Michaels said, “I like to use it because it makes the content I’m teaching seem more validated and that their teacher probably knows what he’s talking about—rather than some guy up there talking from a book.” Student interest in technology was also mentioned in the interview. Mr. Michaels stated,
I like having my kids use computers because it is actually a motivation for them to do it. If you give them a piece of paper and a book, they are not going to want to do it. If you give them some kind of technology to play with while they are doing it, it will make it more fun and they probably will do it better.
Overall, the teachers at Citrus Middle School articulated many of the same benefits of technology integration that teachers from both Palm Middle School and Ocean Middle School identified. They also expressed frustration with equipment functionality. Access to equipment seemed to be less of an issue at Citrus Middle School than either Palm Middle School or Ocean Middle School. Despite the reported access to equipment, teachers at Citrus Middle School also purchased their own equipment to ensure daily availability and functionality. The teachers at Citrus Middle School expressed more concern over the district firewall and technology professional development than did the teachers at Palm Middle School or Ocean Middle School.
Group Interview Data Summary. Despite the differences among the three schools, several commonalities can be identified. First, teachers at all three schools viewed active learning as the most effective way of teaching students in the middle grades, and the teachers identified technology as an effective tool to engage students in active learning. All of the participating teachers identified benefits from integrating technology, most in the form of information access and presentation. At all three schools, several barriers to technology use were identified; the most frequently mentioned were equipment related. Teachers expressed particular frustration with the functionality of computers—which included equipment age, as well as compatibility issues. Other equipment-related barriers included access and the restrictiveness of the district firewall. Several teachers expressed concern over the impact that high-stakes testing had on student technology use—particularly that they feel pressure from administration to focus more on skills and less on project-type assignments.
Finally, teachers at both ends of the spectrum in ability to use technology expressed displeasure with the availability of technological professional development. Teachers who were hesitant users of technology reported that there was not enough professional development available, and teachers who were regular technology users were frustrated with the simplicity of the professional development offered.
Case Study Data
An analysis of the frequency counts of codes from the combined individual interviews suggests that equipment-related barriers were a dominant concern for the participating teachers. Equipment-related barriers were mentioned 83 separate times over the course of the 10 interviews, 13.52% of all items discussed in the interviews. Of particular concern was access to equipment, functionality of equipment, and a lack of equipment. Teacher and student use of technology was mentioned 141 times, or 22.96% of the items discussed. Within these 141 separate instances, 94 (66.67%) were related to teacher use of technology; 47 (33.33%) were about student use of technology, which was similar finding to the group interviews. Overviews of eight individual case studies are provided in the next section. Two case study participants are not included in this analysis, as they did not participate in all three components of Phase 2.
Case Study: Ms. Hill. Ms. Hill was a seventh-grade World Geography teacher at Palm Middle School. A 14-year veteran teacher, Ms. Hill had taught fourth grade, seventh grade, and grades 9-12 in Georgia and Florida. She described her teaching philosophy as “all kids can learn and all kids should be given the biggest and broadest opportunity to go way above the bar. I think that people learn through experience.” Her described teaching philosophy, which advocated active learning, was in slight conflict with her expressed role as a social studies teacher. “In U.S. History I felt like my job was to give them a clear picture of why we are like what we are today. In Geography, I really try to give them a skill set.” When asked to explain her role as a social studies teacher, she identified what she would be “giving” the students, which is in conflict with her statement that people learn through experience. It appears from these indices that Ms. Hill would fall into the “teacher as manager” role in Schuerman’s (1998) Matrix of Teaching and Learning Approaches.
Ms. Hill’s use of instructional technology reflected her described role as a social studies teacher more than her stated teaching philosophy. She indicated that her most frequent use of technology was in administrative uses, specifically using PowerPoint presentations as a tool for lesson planning, e-mails, and grade book software. Ms. Hill specifically mentioned using Google Earth, PowerPoint presentations, and websites in her classroom. In an observation of what she deemed to be a typical use of technology, she used a PowerPoint presentation to guide a lecture with graphic organizer (Duplass, 2006), followed by supplemental websites. Used as another mode for presenting information, the websites were quickly visited, and little time was given for a thorough analysis of the available information.
As was indicated in the group interviews, Ms. Hill had encountered barriers to her technology integration. Technology availability had been an issue for her in years prior. To compensate for a lack of technology, she purchased a personal laptop and LCD projector. Ms. Hill and other teachers from Palm Middle School reported that the functioning laptop carts were available for use only in the media center, which was often unavailable due to schedule conflicts. Despite these frustrations and concerns, Ms. Hill viewed technology integration as necessary for preparing her students for tomorrow.
Case Study: Ms. Alexander. Ms. Alexander was an eighth-grade United States History teacher at Palm Middle School. A 10-year veteran teacher, Ms. Alexander had taught fourth grade and eighth grade. When asked to describe her teaching philosophy, Ms. Alexander stated, “I think that when kids explore their world, it’s a lot more meaningful than someone regurgitating.…That was my whole purpose for doing projects, because it gave them hands-on experience with social studies, with the world, with teaching.”
She organized her class in groups and required her students to complete a variety of projects, both within the class and at home. On the day she was observed, students were presenting a 6-week-long assignment on the presidency, which required students to work as a group to research the events in a selected president’s term in office and then teach that information to their classmates. The group presenting during the observation had created a PowerPoint presentation to share their information. After time for the initial research, students completed the assignment at home, including creating the presentation. It appeared from the interview, observation, and class documents that Ms. Alexander fell in the “teacher as facilitator” role identified by Schuerman (1998).
Although she identified technology as being an important part of a student’s education, Ms. Alexander most often mentioned her own equipment use, including e-mail, using a course website, document cameras, and PowerPoint. She rarely mentioned student use of technology, except when referring to at-home access.
Although Ms. Alexander had an LCD projector and a document camera permanently located in her room, she felt that she had limited access to equipment, as the school’s principal restricted use of the laptop carts during the year. She also expressed frustration with the availability of seemingly minor equipment, such as sufficiently long Ethernet cords to permit projecting the Internet using the LCD projector, which the media specialist was reluctant to provide. Interestingly, when asked directly what barriers she faced, her response was, “None. The majority of the kids had technology.” Apparently, she did not conceptualize technology integration to be student use of technology within the classroom. Technology integration was something to be done at home.
Case Study: Ms. Edge. Ms. Edge was a seventh-grade World Geography teacher at Palm Middle School with 6 years of classroom experience, all at Palm Middle School, and all in seventh-grade geography. She identified her role as a social studies teacher as “teaching the kids how to use cause and effect, to understand that you can’t judge the people of the past by today’s standards, and to get them to see outside their personal experiences.” Ms. Edge seemed to operate in the “teacher as facilitator” role (as in Schuerman, 1998), due largely to her dedication to challenging her students’ conception of reality.
Technology is something that she thought was essential in today’s classroom. Specifically, she said teachers should provide students opportunities to develop researching skills using online materials. When asked about how she used technology in her social studies class, Ms. Edge described student use of websites for information gathering and educational games and the use of PowerPoint for group work presentations. An analysis of the documents submitted supported her interview statements. During the classroom observation, students were engaged in review activities using online geography quizzes, which confirmed her statements. The students were responsible for running the technology, and the website was projected for whole-class viewing.
Similar to the other teachers at Palm Middle School, Ms. Edge expressed frustration over equipment availability and functionality. Not only were the carts corralled in the media center, their functionality was questionable. “We used to have four of them [laptop carts for check out], but they have all been scavenged so that we are down to one. And the kids are like little suckling pigs…all corded to the cart, because they won’t charge anymore.” Due to her frustration with the school’s equipment, Ms. Edge, as other teachers have done, purchased her own laptop, document camera, and LCD projector to use in her classroom, thus ensuring daily access to technology.
Case Study: Ms. Buckley. Ms. Buckley was a sixth-grade World Geography teacher at Ocean Middle School with 4 years of teaching experience, all in her current position. When asked about her teaching philosophy, Ms. Buckley stated, “I believe that students learn best by doing, and I try to accomplish this by changing it up often.” An analysis of the class documents provided by Ms. Buckley showed that, although she used a variety of strategies in her class, none required the students to use technology. In the class observation, Ms. Buckley used a PowerPoint review activity, one that was both a presentation of information and a quiz on the five themes of geography. The PowerPoint was completed as a whole-class activity. Judging from these indices, Ms. Buckley operated in the “teacher as manager” approach to learning (Schuerman, 1998).
Ms. Buckley’s self-reported technology integration, as indicated by her responses on the survey, classified her as a frequent user of technology. However, when asked directly, Ms. Buckley acknowledged that she did not regularly use technology, due to her perceived lack of available equipment. This discrepancy demonstrates the occasional gap between teacher self-reported use and actual use. She expressed a desire to have a laptop available for her use. She had three desktops in her classroom, however, one teacher desktop and two for student use. These perceived equipment-related barriers, according to Ms. Buckley, prevented her from integrating technology as she would have liked. An additional barrier to her use, one that was not solely equipment related, was the impact of high-stakes testing. Ms. Buckley indicated that there had been a push at Ocean Middle School to focus on the FCAT.
Case Study: Mr. Stephens. Mr. Stephens was an eighth-grade United States History teacher at Ocean Middle School. He had 12 years of teaching experience in grades 6-11, the majority of which had been at two middle schools, the last 5 years at Ocean Middle School. Prior to teaching, he worked for a computer company and had a long interest in technology.
He viewed his primary role as teaching citizenship education and developing 21st-century skills. He manifested his ideals regarding teaching and social studies education through a democratic classroom, one in which students regularly worked in cooperative groups to complete tasks.
When asked about barriers to technology integration, Mr. Stephens identified a number of issues both at the district and school level that had impacted both him and his colleagues. At the school level, he felt pressure from “office politics” related to equipment checkout, specifically “being perceived as an ‘over-user’ or one who dominates or not being fair to others.” Additionally, the school’s equipment was frequently in need of repair. He was particularly frustrated with the district security policies. Many student flash drives could not be recognized by the school’s computer without an administrative password, which was given only to the technology specialist. He acknowledged the need for security. He saw the benefits of technology integration outweighing the risks. The district, according to Mr. Stephens, saw it differently.
Right now, the district, the school, and the tech coordinator see the risk as more important than student learning. That is clearly something that needs to be changed, in my opinion….We [teachers] monitor them with the use of scissors, we monitor them with during testing, and so why is it that the computer can’t be the same way.
Equipment functionality, district security, and office politics were only a few of the barriers Mr. Stephens identified in the interview. He had felt increased pressure from school administration to focus on tested reading skills and felt that technology-based assignments were not valued because they could not be measured. As a reaction to the perceived pressure, he stated that he had limited the amount of technology he integrated into his social studies class.
Despite these pressures, frustrations, and barriers, Mr. Stephens continued to use technology in his social studies classroom. On the day his class was observed, students were working in groups of three to four to complete what Mr. Stephens has termed “the company project.” This assignment was an ongoing project that lasted for the last 6 to 8 weeks of the school year. In the project, students formed companies that contracted with Mr. Stephens to complete tasks to demonstrate their understanding of the course content and, in return, received “payment.” The students’ final grades for the project were based on the total revenue each group member earned. The students crafted contracts using a word processor, conducted research using the Internet and school databases, created PowerPoint presentations and digital documentaries, and used spreadsheets to outline their payroll.
This technology-integrated project was facilitated by Mr. Stephens, but was directed by the students and their own interests. Mr. Stephens did not have a laptop cart in his room. He had four computers available for student use and worked with other teachers and with the school’s media specialist to provide computer access in other rooms. He managed the technology needs of his students by requiring students to sign up for shifts on the available computers, by completing status reports if they used the computers in other areas, and by providing non-Internet reference materials so that the students would not lose their momentum without a computer. This observed project when combined with statements he made in the interview, suggested that Mr. Stephens operated in the “teacher as facilitator” role (as in Schuerman, 1998).
Case Study: Mr. Adams. Mr. Adams was a veteran eighth-grade United States History teacher at Ocean Middle School with 38 years of middle school teaching experience. He saw the teacher’s role as helping students to develop critical thinking skills. He also explained that students learn best when they are happy and that by using a variety of teaching strategies and encouraging students to use their individual talents, he could provide a welcoming and enjoyable classroom experience. These statements, when combined with an analysis of his class materials, suggested that Mr. Adams fulfilled the “teacher as manager” role (Schuerman, 1998).
Mr. Adams most often used technology, such as using e-mail and an electronic grade book, as an administrative tool. He had used PowerPoint for class presentations and had worked with his teammates to develop interdisciplinary projects that required Internet research. He viewed technology as an elective component in student education
because of all of the regulation that comes along with it. I think the intention is great—but with all the rules and regulations that keep kids from doing the research I think it has taken a giant step backward.
As this statement suggests, Mr. Adams had encountered barriers to technology integration. He listed a number of issues, including his “own insecurity” and time constraints. His dominant concern was with the restrictions to Internet use, specifically the district’s firewall. He did not report any concerns with the functionality of the equipment. “As far as I know they are pretty good. I think the computers need to be upgraded eventually.” His satisfaction with the equipment was most likely due to the fact that he did not use it regularly. He had purchased a laptop for class use, and he did not frequently assign tasks that required the students to use the school’s technology. It seems unlikely that he would be as aware of functionality issues as someone who used technology on a near-daily basis, such as Mr. Stephens.
Mr. Adams saw the benefit of integrating technology within the classroom, specifically with information management. Despite seeing the benefits of using technology, Mr. Adams rarely used it. In an analysis of his class materials, there were no occasions of technology use by either him or the students. On the day of the classroom observation, Mr. Adams utilized a PowerPoint presentation as an exam review. After class, he confided that another teacher had made the presentation and that he was somewhat nervous using it. The students, however, were engaged and seemed to respond well to his use of the presentation software.
Case Study: Ms. Norris. Ms. Norris taught both seventh-grade World Geography and eighth-grade United States History at Ocean Middle School. In her fourth year of teaching, Ms. Norris had taught sixth-, seventh-, and eighth-grade social studies, all at Ocean Middle School.
When questioned about her teaching philosophy, she responded that it was “helping shape and promote growth in children’s aptitude and for them to be able to walk away with something they can implement in their future lives.” She also stated her belief that modeling had a significant impact on student learning. “Basically, if it is modeled for them, then it’s taught in a way that they can grasp it.” This statement suggested that Ms. Norris subscribed to a more teacher-centered learning environment, one with the teacher serving as a manager of information (Schuerman, 1998).
When questioned, it was evident that Ms. Norris’ vision of technology integration was largely teacher centered, “instead of me standing there lecturing and them sitting there staring, I can have a PowerPoint presentation ready. It serves as a visual aid or reinforcement.” We asked if technology was “something that you engage in, or do you see it as something the students can also engage in?” She responded, “The students engage in [it]. Not only are they hearing it, they are also seeing it in front of them.” Although she was likely correct, that the student would be more engaged than in a traditional lecture without visuals, the integration she described was teacher centered. Throughout the course of the interview, Ms. Norris never addressed student use of technology.
When asked about barriers she had encountered when trying to use technology, her predominant concern was her own aptitude. “I’m just not a technological person. I never know what cord goes where.” Ms. Norris could potentially be classified as a reluctant user of technology; of the 27 teachers participating in this study, she was only one not to have home Internet access.
Case Study: Ms. Smith. Ms. Smith was a seventh-grade World Geography teacher at Ocean Middle School. She had 3 years of teaching experience, all in her current position. When asked about the ways in which students learn best, she responded with the following statement.
I would say that every kid can learn—it’s just how to do you tap into how that kid learns. Being a teacher is all about patience and how much you are willing to help that student….Let them try to experience what I’m trying to teach them instead of standing up there going on and on and on about nothing.
Her statement, when combined with an analysis of her class documents, suggested that she operated in the “teacher as manager” role (Schuerman, 1998), which emphasizes modeling and helping students to process reality. Ms. Smith identified technology as an essential component of student education. Her most frequent uses of classroom technology were as an administrative tool and as a form of content presentation, through PowerPoint. She also regularly used websites in whole-class presentations to supplement class discussion and readings. An analysis of the documents provided by Ms. Smith indicated that she regularly used her LCD projector to examine websites and present class content. Indeed, during the observed class, the students engaged in a visual discovery activity in which they analyzed images projected on the screen using the LCD projector.
Ms. Smith indicated that several barriers inhibited her technology integration; the most significant was equipment availability. With regard to availability, she expressed concern over the apparent inequity of equipment dispersal among the academic disciplines. Specifically, all mathematics teachers were provided with a laptop, a document camera, and an LCD projector. Despite the frustration she felt with trying to overcome availability, functionality, and other barriers to technology, Ms. Smith still saw technology integration as a worthwhile endeavor in the social studies.
Crosscase Analysis. Although the teachers in the case study were volunteers, they represented a fairly accurate sample of the 27 surveyed teachers from Phase 1. The Phase 2 participants were largely female, ranged in age from their mid-20s to over 60 years old, and had teaching experience ranging from 3-38 years. Five of the 8 case study participants’ teaching style could be classified as managerial, and three were classified as facilitating.
All of the teachers described the advantages of using technology. They saw it as a tool for information gathering and, in some instances, for encouraging critical thinking. However, only Mr. Stephens could be classified as a high-level user with student-centered integration. The manner in which each teacher utilized the available technology varied depending upon his or her own situation, teaching philosophy, and comfort with technology.
They all expressed concern over various barriers to technology integration. The most frequently identified barriers were equipment access and functionality. As a response to the questionable functionality of school technology, 3 of the 8 teachers had purchased laptops, and 2 had purchased projectors for use in their classroom. Several teachers identified both pressure from high-stakes testing and district security policies as inhibiting their successful utilization of technology.
Discussion
Mixed methods studies may initially appear messy, with information from various data sources contradicting each other. However, there is power in the mess. Survey data is limited in what it can assess; it is limited by the questions asked and what the participant is willing to share. Indeed, Swan and Hofer (2008) stated that “surveys alone cannot explain exactly what respondents mean by their responses or what they thought particular questions meant” (p. 320). Through the use of mixed methods the participants’ responses to a survey can be verified and challenged through the use of qualitative methods. Often, this process will uncover conflicting or clarifying data. This study is no exception.
Contradictions in data were seen in the teachers’ responses about the importance of technology and their actual integration of available tools. The participant teachers indicated their beliefs, through the survey instrument and the interviews (both group and individual), that technology integration was important for student learning and that students learned best in an active, hands-on, classroom. However, in an analysis of their practice, (as evidenced by their survey responses, document analysis, and classroom observations) teachers used technology but clearly not in a manner to encourage student-centered technology use. The teachers reported that they used the Internet to gather information and that it was important for students to do the same. However, few teachers required students to gather and analyze information in the class setting. Indeed, the way in which these teachers integrated technology had not changed significantly in the decade since VanFossen (1999, 2001) initially surveyed Indiana social studies teachers’ use of the Internet.
The teachers in this study used the Internet largely for information gathering, which mirrors the findings from VanFossen’s survey, as well as the 2008 follow-up. Rarely did the surveyed teachers engage their students in activities identified by the experts as higher order Internet use, such as comparing and contrasting websites from different perspectives. The question is, why are teachers continuing to use the Internet in such a limited manner?
The case studies revealed an interesting trend in teacher technology integration that might help to explain why teachers are more often than not using technology in a limited, teacher-centered manner. Teachers at these three schools used technology to support their existing teaching practices. Mishra and Koehler’s (2006) TPACK construct is a useful way to explain the teachers’ technology integration. In the TPACK construct, teachers need not only to know how to use technology, but also know how to use technology to teach their specific field.
In this study, the teachers whose teaching philosophy was managerial used teacher-centered pedagogical methods, with or without technology. The teachers whose teaching philosophy was more constructivist used student-centered pedagogical methods, with or without technology. By adding teachers’ technological knowledge, you have a clearer picture of how these teachers used technology with their students. The teachers not comfortable using the available equipment generally chose other pedagogical methods. The teachers who were comfortable with the available equipment used technology in a manner that supported their pedagogical style, whether teacher or student centered.
Technology was not an agent of pedagogical reform, from teacher-centered instruction to student-centered learning, which it is often championed to be. Rather, it was a tool that teachers used within the context of their existing pedagogical approach. These results are not surprising, as Cuban (2001) had similar findings in his study of California teachers’ technology integration. If this trend holds true, then one cannot expect to see student-centered use of technology if the teacher does not subscribe to a student-centered approach to learning. Utilization of a new tool will not alter the way in which the teacher constructs the learning environment.
These three schools have a great deal of available technology, considering the number of computers in the rooms, available laptop carts, and access to projectors. Yet, the participating teachers saw access to technology and the functionality of equipment as a barrier to their use and a reason for the discrepancy between their desire to use technology and their practice.
The teachers identified multiple administrative policies that have hindered their use—such as Palm Middle School’s laptop cart checkout policy and the district’s security measures. Requiring teachers to remain in the media center to use a portable laptop cart was an often-discussed reason why the teachers at Palm Middle School were not using the available equipment. The benefits of using a portable laptop cart (time, flexibility, and classroom management) were eliminated when the administration decided that the carts should remain in a central location. The media center was reportedly overbooked, and when available it was an environment incompatible with learning. Palm Middle School’s media center was a difficult-to-use computer lab functioning in a highly used meeting room—not an ideal situation for effective technology integration.
The district’s Internet firewall was all-inclusive; all users are blocked from potentially threatening websites. Teachers in this study repeatedly expressed frustration with the limits placed on their Internet access, especially when attempting to access images and video. Several of the teachers suggested an alternative, having levels of firewalls that are accessed with the user’s login codes. In this system, teachers would have more latitude to access instructional materials on the Internet that are blocked by more stringent firewall measures.
Several of the teachers expressed concern with the security measures inhibiting functionality, specifically newer flash drives not being recognized by the school’s equipment. Newer flash drives often have to be loaded onto a computer upon their initial use. The way the school system currently operates, teachers do not have administrative access to load software, which would include these flash drives. The teachers wanted to be provided with limited administrative privileges so they could load flash drives and troubleshoot potential problems.
Technology is always evolving; therefore, the functionality and compatibility of equipment will be a continuing problem for schools. Indeed, most of the teachers at the three participating schools expressed frustration with the functionality of the equipment available for their instructional use. These frustrations included slow boot-ups, laptop batteries not holding a charge, hardware and software incompatibility, and slow Internet access during high-use times.
Several of the teachers, including four of the Phase 2 participants (Mr. Adams, Mr. Stephens, Ms. Edge, and Ms. Hill), all purchased equipment with their own money as a way to work around the schools’ underfunctioning technology. This reality is unfortunate for the teachers in this study. If they wanted to be sure that the technology in their classrooms functioned, they felt that they had to purchase their own. The schools’ equipment could not be trusted to work when needed.
Several of the participating teachers identified high stakes testing as having a negative impact on their ability to use technology in the classroom. The perceived test-related barriers were twofold. First, the teachers felt their access to the available computers was limited, as laptop carts were being used to run test-preparation software. Ms. Roberts stated that access to the available carts was limited to the subjects assessed on the test: “I’ve been kicked out of the lab or had the lab taken away from….They know we aren’t going to do FCAT explorer, so we don’t need it [access to the computers].”
She was not the only teacher to express frustration with limited access for non-test-preparation use of laptop carts. Several of the participants referred to the carts being inaccessible in the weeks prior to the state testing, as they were checked out for test preparation. In addition to the perceived restricted access was the teachers’ interpretations of their school administrators’ emphasis on measurable results. Interestingly, none of the participating teachers stated that they viewed student-centered technology integration as incompatible with preparing students to perform on the state’s high stakes test. However, several of them expressed concern about the measurability of student performance in technology-oriented projects.
Findings from this study suggest that a single-cause explanation for why teachers do or do not integrate technology into their teaching is insufficient. Multiple factors influence the teachers’ practices, including access and functionality of technology, teacher attitude toward and comfort with technology, and teaching philosophy and pedagogical practice. The complex interaction between teaching philosophy and the comfort and attitude toward technology may potentially hold the key to understanding teacher technology integration, which indicates that the TPACK framework may be useful in analyzing teacher practice. However, one cannot overemphasize the impact of external factors on teachers’ technology integration. Whether these factors were merely perceived or real impediments, the teachers saw them as prohibiting their use.
Conclusion
Overall, for the teachers in this study not much had changed in the 10 years since VanFossen (1999, 2001) initially examined teachers’ use of the Internet. Indeed, the findings in this study verify the trends seen in VanFossen’s and Cuban’s (2001) studies; technology integration is limited to largely teacher-centered information gathering, and teachers are utilizing available technology not to transform their teaching, but to reinforce their existing pedagogical practice. It will be interesting to see if teacher technology integration remains rooted in information gathering as Web 2.0 resources become increasingly available. VanFossen’s (2005) Internet Use Survey will need modification to address new Internet capabilities before teachers’ Internet use is reassessed.
Perhaps most intriguing for potential further study is the examination of teachers who, despite the many identified barriers, persist in student-centered technology integration. Questions remain as to why teachers like Mr. Stephens are able to utilize technology in a dynamic and creative manner. What makes such teachers different from their colleagues who resist technology integration or abandon efforts to integrate technology at the first barrier? Case studies that involve multiple interviews with both teachers and students, extensive observation, and document analysis of these teachers may provide an understanding as to why such teachers are different from their colleagues. An understanding of such differences can help to inform preservice teacher preparation and in-service professional development.
References
Berson, M. J., & Balyta, P. (2004). Technological thinking and practice in the social studies: Transcending the tumultuous adolescence of reform. Journal of Computing in Teacher Education, 20(4), 141-150.
Berson, M. J., & Bolick, C. M. (2007). Technology and the social studies: Advancing practice with research. Theory & Research in Social Education, 35(2), 150-152.
Creswell, J. W., & Plano Clark, V. L. (2007). Designing and conducting mixed methods research. Thousand Oaks, CA: SAGE Publications.
Cuban, L. (2001). Oversold and underused: Computers in the classroom. Cambridge, MA: Harvard University Press.
Duplass, J. A. (2006). Middle and high school teaching: Methods, strategies and best practices. Boston, MA: Houghton Mifflin Company.
Ertmer, P. (2005). Teacher pedagogical beliefs: The final frontier in our quest for technology integration? Educational Technology Research & Development, 53(4), 25-39. doi: 10.1007/BF02504683
Ertmer, P., Ottenbreit-Leftwich, & York, C. S. (2006-2007). Exemplary technology-using teachers: Perceptions of factors influencing success. Journal of Computing in Teacher Education, 23(2), 55-61.
Franklin C. A., & Molebash, P.E. (2007). Technology in the elementary social studies classroom: Teacher preparation does matter. Theory & Research in Social Education, 35(2), 153-173.
Friedman, A. M. (2006). World history teachers’ use of digital primary sources: The effect of training. Theory & Research in Social Education, 34(1), 124-141.
Glaser, B. G. (1965). The constant comparative method of qualitative analysis. Social Problems, 12(4), 436-445.
Gray, L., Thomas, N., & Lewis, L. (2010). Teachers use of educational technology in U.S. public schools: 2009 (NCES 2010-040). Retrieved from http://nces.ed.gov/pubsearch/pubsinfo.asp?pubid=2010040
Koehler, M. J., & Mishra, P. (2008). Introducing TPCK. In AACTE Committee on Innovation and Technology (Ed.), Handbook of technological pedagogical content knowledge (TPCK) for educators (pp. 3-29). New York, NY: Routledge.
Manfra, M. M., & Hammond, T. C. (2008-2009). Teachers’ instructional choices with student-created digital documentaries: Case studies. Journal of Research on Technology in Education, 41, 223-245.
Martorella, P. H. (1997). Technology and the social studies – or: Which way to the sleeping giant? Theory & Research in Social Education, 25(4), 511-514.
Merriam, S. B. (1998). Qualitative research and case study applications in education. San Francisco, CA: Jossey-Bass Publishers.
Mishra, P., & Koehler, M.J. (2006). Technological pedagogical content knowledge: A framework for teacher knowledge. Teachers College Record, 108(6), 1017-1054.
Onwuegbuzie, A. J., & Leech, N. L. (2005). On becoming a pragmatic researcher: The importance of combining quantitative and qualitative research methodologies. International Journal of Social Research Methodology, 8, 375-387.
Palak, D., & Walls, R. T. (2009). Teachers’ beliefs and technology practices: A mixed-methods approach. Journal of Research on Technology in Education, 41, 417-441.
Sheurman, G. (1998). From behaviorist to constructivist teaching. Social Education, 62(1), 6-9.
Shiveley, J. M., & VanFossen, P. J. (2009). Toward assessing Internet use in the social studies classroom: Developing an inventory based on a review of the literature. Journal of Social Studies Research, 33, 1-32.
Shulman, L. S. (1986). Those who understand: Knowledge growth in teaching. Educational Researcher, 15(2), 4-14. doi: 10.3102/0013189X015002004
Swan, K. O., & Hofer, M. (2008). Technology and social studies. In L. S. Levstik & C. A. Tyson (Eds.), Handbook of research in social studies education (pp. 307-326). New York, NY: Routledge.
Tashakkori, A., & Teddlie, C. (1998). Mixed methodology: Combining qualitative and quantitative approaches. Thousand Oaks, CA: SAGE Publications.
VanFossen, P. J. (1999). An analysis of the use of the Internet and world wide web by secondary social studies teachers in Indiana. International Journal of Social Education, 14(2), 87-109.
VanFossen, P. J. (2001). Degree of Internet/www use and barriers to use among secondary social studies teachers. International Journal of Instructional Media, 28(1), 57-74.
VanFossen, P. J. (2005). Indiana social studies Internet use survey. Retrieved from ttp://www.edci.purdue.edu/vanfossen/internet/
VanFossen, P. J., & Waterson, R. A. (2008). “It’s just easier to do what you did before…”: An update on Internet use in secondary social studies classrooms in Indiana. Theory and Research in Social Education, 36(2), 124-152.
Whitworth, S. A., & Berson, M. J. (2003). Computer technology in the social studies: An examination of the effectiveness literature (1996-2001). Contemporary Issues in Technology and Teacher Education, 2(4), 472-509. Retrieved from https://citejournal.org/vol2/iss4/socialstudies/article1.cfm
Yin, R. K. (2003). Case study research design and methods (3rd ed.). Thousand Oaks, CA: SAGE Publications, Inc.
Author Note
Caroline C. Sheffield
University of Louisville
email: [email protected]
Appendix A
Group Interview Protocol Questions
- How do you think students learn best? Please explain your answer.
- What type of technology, other than the Internet, are you using with your social studies classes?
- How would you describe your technology use with your social studies classes? Please describe the way you typically use technology in your social studies class.
- In your opinion, is it beneficial to use technology with your students? Please explain.
- What factors do you see encouraging or inhibiting your use of technology in your social studies classes?
- Equipment availability?
- Comfort with technology?
- Appropriate training?
- FCAT pressure?
- If you could alter the factors influencing your integration of technology, would you? If you would, how would you change your current situation and instructional practices?
Appendix B
Individual Interview Protocol Questions
- How long have you been teaching?
- What grade levels have you taught? Where?
- What is your educational background?
- Is teaching your first career? If not, what other types of employment have you had?
- When did you complete your education coursework?
- What type of technology was included in your teacher preparation, if any?
- What do you see as your primary role as a social studies teacher? (Follow up question as necessary.)
- How would you describe your teaching philosophy?
- What type of environment do you think is best for student learning?
- Describe a typical day in your classroom. What are you doing? What are the students doing?
- In what ways do you currently use technology for administrative purposes?
- Do you view the inclusion of technology as essential or an elective component in student education? Please explain.
- How do you envision technology integration? Is this vision a reality? Please explain.
- With regards to technology in the classroom, what do you feel most confident doing? What do you feel least confident? Has your confidence levels influenced your technology integration? How?
- What barriers do you encounter when trying to integrate technology?
- Probing questions related to: materials, management, support, and skill
- How has high-stakes testing affected your technology integration?
- When you hear the term higher-order thinking, what do you envision?
- How do higher-order thinking and technology relate to one another?
- How do you include technology in your social studies class?
- Follow up questions related to: materials, management, planning and projects
- Describe your plans for the year – re: technology and higher-order thinking.
This list of questions is a base of questions. Other questions may arise during the interview.
Appendix C
Matrix of Codes Used in Qualitative Analysis
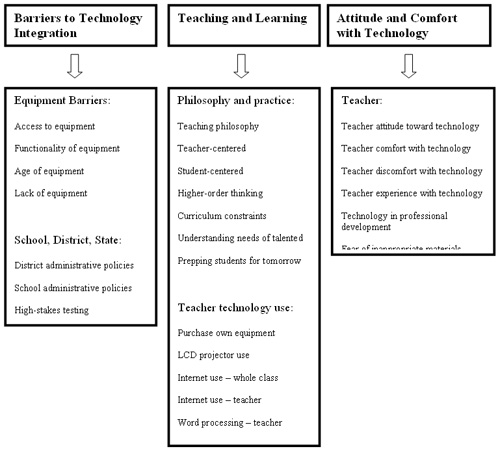
Appendix D
Appendix E
![]()