Preservice mathematics teachers (PSMTs) should become proficient with using technology tools when doing mathematics as well as when preparing for and supporting students’ learning of mathematics (Association of Mathematics Teacher Educators, 2017), which is particularly important for the mathematical science of statistics. The demands of today’s data-driven society and the exponential growth in the storage of and reliance on data has created the need for a data savvy citizenry, fluent in working with data using technology (Boaler & Levitt, 2019; Finzer, 2013). Thus, PSMTs need purposeful instruction regarding how to do and teach statistics using technology.
Attention to the preparation of mathematics teachers to teach statistics, including using technology, is currently critical based on the emphasis on statistics and data science in the Common Core State Standards for Mathematics (CCSS-M; National Governors Association Center for Best Practice & Council of Chief State School Officers, 2010) and state standards (e.g., Public Schools of North Carolina, 2019). Those involved in the preparation of mathematics teachers have been called to enhance and prioritize statistics teacher education (Franklin et al., 2015).
At present, secondary teachers are not leaving teacher education programs with confidence to teach statistics. Lovett and Lee (2017) asked PSMTs to compare their preparation to teach algebra, geometry, advanced algebra/precalculus, statistics, and calculus; more than 60% of PSMTs reported they felt least prepared to teach statistics.
To meet these current needs in mathematics teacher education, the Enhancing Statistics Teacher Education With E-Modules (ESTEEM) project created teacher education curriculum materials that prepare PSMTs to teach statistics with the technology tool Common Online Data Analysis Platform (CODAP; Concord Consortium, 2019). CODAP is a free, web-based, educational software designed to help students learn how to analyze data. It supports three key aspects related to best practices for teaching statistics that are emphasized in the ESTEEM materials: (a) analysis of large, multivariate, real datasets; (b) continual connection to context; and (c) engagement in the statistical investigation cycle.
This study investigated the extent to which PSMTs who used the ESTEEM project’s curriculum materials incorporated these key aspects into CODAP-enabled tasks they created for use with grades 4-12 students.
Literature Review
This section provides an explanation and justification of the three key aspects for teaching statistics. It is followed by a section on statistical tasks that describes characteristics of statistical tasks in school textbooks and provides evidence that PSMTs need to learn how to design their own statistical tasks.
Key Aspects for Teaching Statistics
The importance of the first key aspect, analysis of large, multivariate, real datasets, comes from the fact that this is an era of big data. In this modern era, teachers must provide opportunities for students to work with large, multivariate datasets that are real and from meaningful contexts (Lee, 2019).
Newer curriculum standards reflect this thinking as well, adapting expectations regarding the size of datasets that students investigate. For example, the North Carolina Standard Course of Study for Math 4 (Public Schools of North Carolina, 2019) called for students to analyze real datasets with three or more attributes and more than 200 cases using technology.
CODAP supports students’ engagement with large, multivariate data since the user can easily import and work with a large dataset. Although the graphing calculator is the most widely used technology tool in secondary classrooms, it does not support engagement with datasets that are large and multivariate. Thus, PSMTs must learn to use and teach with a technology tool like CODAP that supports analysis of big data.
The second key aspect, continual connection to context, emphasizes a characteristic of statistics that distinguishes it from mathematics (Rossman, Chance, & Medina, 2006). Statistical reasoning is inextricably linked to the context of the data, and teachers must stay true to that in their statistics teaching (Franklin et al., 2015). For example, when reading statistical graphs, one should go beyond noting the features of the distribution to interpret those features in the context of the dataset and consider implications. Features of CODAP that support users in staying connected to the context of the data include (a) use of labels, (b) ability to put additional information about the data and its attributes in hover windows or textboxes, (c) ability to link to original, online sources, and (d) images (e.g., maps).
The third key aspect is engagement with the statistical investigation cycle. Also known as the statistical problem-solving process (Franklin et al., 2015), the statistical investigation cycle consists of four phases that are often used in a statistics investigation: posing a question, collecting data, analyzing data, and interpreting results (Franklin et al., 2007).
PSMTs should engage in the statistical investigation cycle regularly in their courses (Franklin et al., 2015) and be prepared to teach the cycle per the CCSS-M (National Governors Association Center for Best Practice & Council of Chief State School Officers, 2010). CODAP’s interface makes it possible for users to carry out and document their statistical investigation in a single document. Generating graphs and statistical measures is also quick and easy in CODAP, removing the burden of laborious data analysis from the user and allowing the user to shift attention and effort to other aspects of the statistical investigation cycle. The ESTEEM materials highlight these key aspects for teaching statistics repeatedly, culminating in their inclusion in a set of guidelines for considering the components of a statistical task (Tran & Lee, 2015).
Statistical Tasks
Although the textbooks that K-12 teachers use likely have a selection of statistics tasks available, these tasks typically do not meet the three key aspects of teaching statistics. Jones et al. (2015) examined the statistical content in five popular series of elementary textbooks and found that, of the four phases of the statistical investigation cycle, the analysis phase was attended to much more than the other three phases. Overall, more than seven times as many tasks required students to analyze data than did the other three phases combined. This ratio tended to be higher for commercial textbook series than for textbooks funded by the National Science Foundation, with one commercial textbook series having 16 times as many tasks requiring students to analyze data than the other three phases combined.
At the high school level, Weiland (2019) examined the statistical tasks in two popular mathematics textbook series. He found that strong connections to context were made throughout the statistical tasks in the textbooks. However, the datasets presented were typically not large, multivariate, or real. Across the textbooks, almost all of the datasets included only one or two variables, and the percentage of datasets with both quantitative and categorical variables was minimal (between 1.0% – 8.4% for each textbook). The sizes of the datasets were small. The median number of cases in a dataset ranged from eight to 12, and the vast majority of datasets included fewer than 20 cases. A source for data was rarely provided in the textbooks, and thus, most of the data seemed to not be real.
Evidence indicates that tasks found in introductory statistics textbooks at the college level tend to fare better. In a study of 25 college introductory statistics textbooks, Dunn, Carey, Farrar, Richardson, and McDonald (2017) found that 64% used real data effectively, 68% emphasized concepts over procedures, and 56% promoted the development of statistical thinking. However, students need to work through meaningful statistical tasks in advance of college in order to develop the statistical literacy needed in today’s big data era.
Teachers seem to be relying on sources other than textbooks for tasks. Shapiro, Sawyer, Dick and Wismer (2019) found this circumstance to be true for mathematics teachers, specifically. They found that over half of elementary mathematics teachers attempt to find tasks online at least weekly. Additionally, teachers in a recent national survey indicated that on average they spent 5 hours per week creating their own instructional materials and most of the materials they used in their classroom were self-created (Gorman, 2017). Thus, teachers could benefit from guidance on how to create high-quality statistical tasks.
Multiple frameworks have been used to analyze statistics and data analysis tasks. Curcio’s (1987, 1989) work, which was later augmented by Shaughnessy (2007), presented a structure to analyze questions that elicit various levels of graph comprehension. These four types of questions in their structure are as follows: (a) reading the data, (b) reading between the data, (c) reading beyond the data, and (d) reading behind the data.
A description of each question type and an example involving analysis of a dataset about roller coasters’ characteristics is described next. Reading the data refers to the direct extraction of information that is apparent from a graph (e.g., What is the length of the roller coaster with the largest drop?). Reading between the data requires the integration of data and a mathematical concept or procedure (e.g., How many roller coasters have a drop of more than 100 feet?).
The other two levels provide greater attention to the context of the data. Reading beyond the data refers to making predictions or inferences about the data (e.g., If a roller coaster is made of steel, is it more likely to have inversions or not?) or asking questions about the generation of the data itself, such as how it was collected. Shaughnessy (2007) proposed an extension to Curcio’s original three levels, which he termed reading behind the data. It involves drawing connections between the data and its context to explain why observed trends occur (e.g., Why do roller coasters with a large maximum height tend to also have longer track lengths?).
Resources for Learning and Teaching Statistics
This section presents information regarding the data analysis tool CODAP and the ESTEEM project’s curriculum materials. This study used both of these resources; thus, this section provides an orientation to each of them.
CODAP
CODAP (Concord Consortium, 2019) is an open-source data analysis tool designed for use with students in grades 6-14. Figure 1 illustrates a typical display in CODAP using a dataset about 157 roller coasters in the U.S.
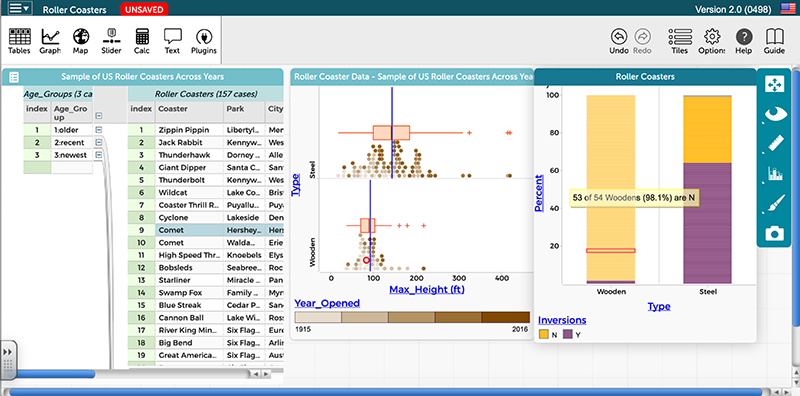
Data are arranged in a case table on the left side of the figure, with each row representing a single roller coaster. CODAP allows users to investigate data by creating data representations. The stacked dot plot compares the maximum height of roller coasters disaggregated by type (i.e., wooden or steel). Dot plots are overlaid with box plots, and the blue vertical lines denote the means of each type.
CODAP also allows users to display other measures, such as counts, percents, medians, standard deviations, and mean absolute deviations. A third variable, year opened, is shown by the color gradient at the bottom of the graph. Older roller coasters are designated by lighter dots, whereas darker dots represent recently opened coasters.
The segmented bar graph shown allows students to investigate the association between two categorical variables, type of roller coaster and whether it has inversions or not. CODAP can also display scatterplots to investigate the relationships between quantitative variables. All data representations are dynamically linked, as shown by the highlighted coaster (i.e., Comet) in the case table and identified in red in the dot plot and segmented bar graph.
Although CODAP has many similarities to other dynamic data tools, such as TinkerPlots (Konold & Miller, 2005) and Fathom (Finzer, 2002), CODAP has many differences. As a web-based tool, users do not need to download software, but can access CODAP through a web browser with an internet connection. CODAP allows data to be organized hierarchically, as shown in the case table in Figure 1 where the data is organized using the attribute age group. The ability to plot data on a map in CODAP also allows students to investigate geospatial data. To learn more about CODAP’s features and how to use it, view the videos in the CODAP tutorials playlist (https://www.youtube.com/playlist?list=PLq_mgFaS8OGYF1cKF4IrBl_0RwB_SWQk1)
ESTEEM Curriculum Materials
The ESTEEM project’s curriculum materials seek to improve PSMTs’ preparation to teach statistics by engaging them in curriculum materials that consist of three e-modules, each approximately 2 weeks in length. The first, titled the Foundations in Statistics Teaching Module, focuses on key differences between statistics and mathematics and how to support student engagement in statistical investigations. For example, this module helps PSMTs learn how to launch an investigation for students to complete by connecting them to the context of the data.
The other two modules focus on developing statistical knowledge for teaching two key concepts in statistics: (a) inferential reasoning and (b) statistical association, including both bivariate quantitative and bivariate categorical data.
All modules support PSMTs in learning to use CODAP as a tool to investigate data, such as the roller coaster dataset discussed previously. Through opportunities to analyze classroom episodes where teachers used CODAP as a tool in school settings, PSMTs reflect on students’ use of CODAP and the pedagogical action of teachers who use it. The e-modules can be imported directly into learning management systems and include the following features throughout: readings, videos or animations of statistics classrooms, videos of students’ thinking about data, videos of interviews with classroom teachers, discussion board prompts, and data investigations.
The ESTEEM materials also include a Task Design Assignment as a summative assessment (see appendix). The assignment requires PSMTs to design a CODAP-enabled statistical task and consider how to enact the task in a school classroom. The assignment consists of six parts:
- Introductory information, including a task summary, audience, time needed, materials, shareable CODAP link, general statistical goal, specific learning objectives, and sources;
- Description of how to launch the task;
- Task handout, including questions that will be posed to students o;
- Examples of anticipated students’ work;
- Notes for implementing the task; and,
- One-page reflection describing what the PSMT considered during task design and what they learned as a result.
This study focused on the following research question: How are the three key aspects for teaching statistics reflected in the CODAP-enabled tasks created by PSMTs who have learned about teaching statistics from using the ESTEEM materials?
Methodology
Participants
The participants in this study consisted of 75 PSMTs from five different universities that were geographically dispersed throughout the U.S. All participants were enrolled in a university course using the ESTEEM materials during the 2018-19 academic year, whose instructor assigned the Task Design Assignment.
Although students in each of the five classes were taught with the ESTEEM curriculum materials, these materials were used for only a portion of a semester (typically 3 weeks). These 75 participants completed 73 unique Task Design Assignments. One instructor (at Institution A) permitted PSMTs to complete the assignment in pairs, which accounts for the difference between the number of PSMTs and assignments. Table 1 provides additional information about the participants, by institution.
Table 1
Participant Information by Institution
| Institution | Number of PSMT Participants | Audience |
|---|---|---|
| A | 7 (5 assignments) | Preservice secondary (6-12) teachers in Southeast |
| B | 19 | Preservice (and one inservice) secondary (6-12) teachers in Midwest |
| C | 19 | Preservice elementary and middle school (K-9) teachers seeking a math minor in Midwest |
| D | 18 | Preservice elementary and middle school (K-8) teachers seeking a math major in Midwest |
| E | 12 | Preservice middle school teachers in West |
Data Analysis
Data for this study came from the first three parts of the Task Design Assignment. The data sources included the assignment submission, linked CODAP document, and handouts prepared for students. In some cases, PSMTs embedded the task’s questions within the CODAP document.
Part 1 of participants’ Task Design Assignment was analyzed to determine how well tasks included the first two key aspects for teaching statistics: (a) analysis of large, multivariate, real datasets and (b) continual connection to context. Analysis included examination of the dataset used in the task, including the context, data source, number of cases, and the number and type of attributes (i.e., categorical, quantitative, and naming). Analysis also included an examination of the CODAP document to be shared with students, where researchers identified the types of data representations included in the document when opened, as well as whether information about how to use CODAP or the data source were included.
Each data source was examined to determine if the data were real or fabricated. Counts and means for different characteristics of the datasets and CODAP documents were tabulated. Part 1 of the assignment was analyzed by one member of the team then checked by a second member of the research team. Discrepancies were discussed until a consensus was reached.
Next, all 73 Task Design Assignments were prepared for analysis and uploaded to NVIVO to determine how well the designed tasks aligned with the second and third key aspects for teaching statistics: continual connection to context and engagement in the statistical investigation cycle. These analyses focused on PSMTs’ descriptions of their launch in Part 2 of the assignment and the student handout created for Part 3.
Two members of the research team initially created the coding framework by reviewing a subset of the data and identifying features of the assignments that reflected the second and third key aspects for teaching statistics. The development of the coding framework drew upon Tran and Lee’s (2015) guidelines for analyzing a statistical task, as it was aligned with the three key aspects for teaching statistics. The two researchers independently applied the initial coding framework to a small subset of PSMTs’ submissions for Parts 2 and 3 of the assignment then met to discuss their results and refine the coding framework.
This process was repeated twice more to revise then finalize the coding framework. The final coding framework used to analyze parts 2 (launch of task) and 3 (student handout and associated CODAP document) of all tasks in the dataset is presented in Table 2.
Table 2
Codes Used to Analyze the Launch and Handout
| Code | Code Description |
|---|---|
| Orientation to Context | identifies whether the PSMT made explicit plans to help students make sense of the context of the dataset during the launch to the investigation. Subcodes described the type(s) of methods used, such as showing a video, asking students a question, or collecting data from the students |
| Orientation to Dataset | identifies whether the PSMT made explicit plans to acquaint students to the dataset itself, such as reviewing the meanings of some or all of the attributes |
| Levels of Graph Interpretation | level at which PSMTs’ questions asked the students to make claims about the data displayed in a graph or other data representation. Levels include reading the data, reading between the data, reading beyond the data, and reading behind the data |
| Predominant Level of Graph Interpretation | level that included the majority of the questions posed or described the overall purpose of the task |
| Pose/State Statistical Question | describes whether the teacher specifically stated the driving statistical question to students |
| Pose/Student Pose Statistical Questions | identifies whether the task provides at least one opportunity for students to pose their own statistical question about the dataset |
| Collect/Plan | describes whether the intended implementation offers opportunities for students to discuss the data collection (e.g., sampling, sample size) |
| Collect/Choose Attributes | describes whether students are provided with opportunities to determine which attributes in a dataset should be used for analysis |
| Analyze/Representation | identifies the type(s) of data representations that students were asked to create using CODAP or other means, such as dotplots or segmented bar graphs |
| Analyze/Numerical | identifies the type(s) of numerical analyses that students were asked to find, such as finding the mean or standard deviation |
| Interpret/Answer Driving Statistical Question | identifies whether students revisit and answer the driving statistical question for the activity |
| Interpret/Context in Claims | identifies whether students were ever prompted to make claims that incorporate the dataset’s context |
In the analysis of parts 2 and 3 of the Task Design Assignment, the data were initially coded in NVIVO by one member of the research team and checked for accuracy by a second member of the research team. The final phase of analysis involved summarizing the results of the coding with respect to each of the key aspects. Each key aspect’s results were summarized by a pair of researchers.
Results
The results of our analysis are presented below, organized into findings related to three key aspects for teaching statistics: analysis of large, multivariate, real datasets; continual connection to context; and engagement in the statistical investigative cycle.
Key Aspect 1: Analysis of Large, Multivariate, Real Datasets
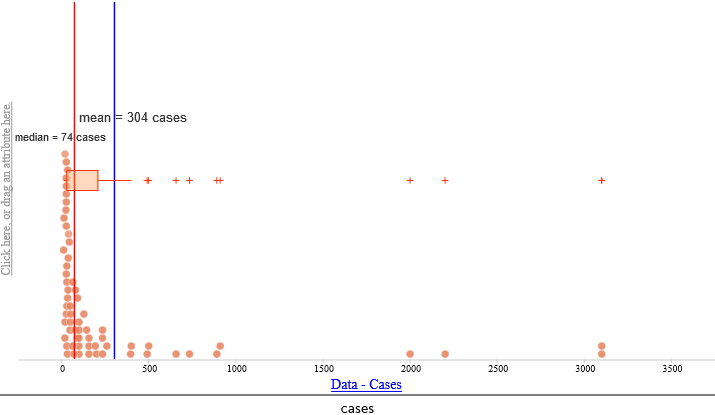
To determine whether the PSMTs’ designed tasks engaged students in using large, multivariate, real datasets (Key Aspect 1), we examined characteristics of the datasets. First, we analyzed the number of cases in the datasets used in the tasks (see Figure 2). The minimum number of cases included in a dataset was 12 and the maximum number of cases was 3,100, with a mean of 304 cases and median of 74 cases. Many of the tasks utilized large datasets, since half of the tasks were based on data with at least 74 cases, a reasonably large number of cases for students in grades 4-12 to analyze.
Concerning the multivariate nature of the datasets, approximately 15 (mean of 14.5) attributes were provided per case. None of the datasets included just one attribute per case; the minimum number was two attributes. Half of the datasets included 11 or more attributes, and there were five datasets (all sourced from American Statistical Association, n.d.) that provided 60 attributes per case.
Regarding the types of attributes in the datasets, 79% of the datasets included both quantitative and categorical attributes. Hence, the datasets used in the tasks were multivariate, usually including both quantitative and categorical attributes.
Finally, the vast majority of the datasets were determined to be real datasets. Fifty-five tasks used precollected, real data, while another six used real data collected by the students in the class. In total, 61 of the 73 tasks (83.5%) utilized real data. Five of the 12 other tasks used CODAP’s sampler tool to create simulated data. For example, the CODAP document for one of these tasks included a sampler designed to simulate rolling a dice. In enactment of the task, a student would use the sampler to generate simulated data regarding what would happen if a die was rolled at least 30 times.
Key Aspect 2: Continual Connection to Context
Both the CODAP document to be used in the task and the launch of the task were analyzed regarding how they connected to the context of the dataset (Key Aspect 2), if applicable. Sixty-three of the 73 (86%) tasks included a CODAP document with a case table containing labeled attributes or a naming of the dataset that connected to the context. None of the tasks that used real data collected by the students did this, as the students were to put the data into CODAP themselves.
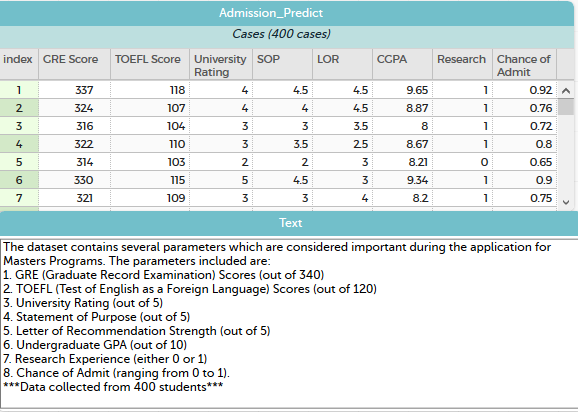
In addition, six of the CODAP files included a textbox with information about the data source, and four of the CODAP documents provided a textbox with information about the contextual meanings of the attributes. To illustrate, Figure 3 shows the contents of a CODAP document used in one of the tasks created by a PSMT. This task was designed to have students investigate attributes that colleges consider when determining entrance into master’s degree programs. The CODAP document contains a case table labeled “Admission Predict” and contains eight, contextually labeled attributes that are defined in the accompanying textbox. These features kept the work in the task connected to the data’s context.
The launch of the task in this assignment provided another opportunity for PSMTs to connect students with the context of the dataset. Fifty of the 73 task launches (68%) oriented the students to the context of the data, most often by asking the students questions that personally connected them with the context.
For example, one task’s planned launch began by asking the students how many sodas they drink in a week and how many grams of sugar they think is in a can of their favorite soda. This question led into a task where the students analyzed a dataset regarding the sugar content of different sodas. During the launch, 34% of the teachers also planned to familiarize the students with the dataset’s attributes by talking through the meaning of each attribute in context. Overall, connections to the context were made in both the presentation of the dataset and the launch in most tasks.
Key Aspect 3: Engagement in the Statistical Investigation Cycle
Tasks were analyzed to determine how students were expected to engage with each of the four parts of the statistical investigation cycle: posing a question, collecting data, analyzing data, and interpreting results (Key Aspect 3). Twelve tasks (16%) prompted students to pose their own statistical question. Some of these prompts occurred after an initial orientation to the dataset.
For example, after introducing students to a Census at School dataset (American Statistical Association, n.d.) and showing students how to see the descriptions of each of the attributes and create basic graphs, one task asked students, “What three questions do you have after doing this initial exploration?” Other times, after completing a statistical investigation, students were asked to pose additional questions they could answer with the dataset (e.g., “What other questions could you ask about the dataset? How could these questions be used in your proposal for the school principal [to choose the best movie production company]?”).
Of these 12 tasks that asked students to pose their own questions, eight also asked students to investigate these questions and state their findings. Overall, 49% of the tasks included the posing of a driving statistical question, either student-generated or provided in the task, which served as motivation for the creation of graphs and additional analyses performed on the data.
Concerning the involvement of students in the collecting data phase, over half (53%) of tasks allowed students to choose which attributes of a dataset to analyze. This is an appropriate way to engage in the collecting data phase when one is provided a large dataset. Occasionally, this choice was tied to a specific question of interest (e.g., determining which attributes could be used to select a movie production company to hire or which attributes would impact how likely someone would get accepted to a college). More often this question was more general, asking students to choose two attributes they were interested in. Although some of the PSMTs expected students to collect their own data, none of the PSMTs described involving students in planning the data collection, such as selection of sample size or consistency in measurement methods used during data collection.
Regarding analysis of data, 90% of the tasks specifically asked students to create a graph or visual representation of the data, and 77% prompted students to use a numerical measure to analyze data. The specific types of visual representations and numerical measures that students were expected to use are shown in Table 3.
Visual representations created in CODAP included two-way binned plots, which are representations of bivariate categorical data similar to two-way tables but with each individual case displayed as a dot in a cell of the table. A one-way binned plot is a similar representation for one categorical attribute. Stacked dot plots and stacked box plots display a quantitative attribute on one axis, disaggregated by a categorical attribute on the other axis, resulting in a stacking of the chosen graph as shown in the graph in the center of Figure 1.
Table 3
Visual Representations and Numerical Measures Expected to Be Used in Tasks
| Visual Representation | Percentage of Tasks | Numerical Measure | Percentage of Tasks |
|---|---|---|---|
| Scatterplot | 42% | Mean | 33% |
| Stacked dot plot | 42% | Maximum or minimum | 26% |
| Dot plot | 29% | Counts | 19% |
| Two-way binned plot | 19% | Percentage | 16% |
| One-way binned plot | 11% | Determine outlier | 15% |
| Stacked boxplot | 8% | Median | 14% |
| Boxplot | 4% | Line of best fit | 11% |
| Segmented bar graph | 4% | Correlation coefficient or Coefficient of determination | 11% |
| Bar graph | 3% | Interquartile range | 8% |
| Map with attribute overlaid | 1% | Range | 8% |
| Standard deviation | 3% | ||
| Other | 6% |
Most commonly, students were expected to make bivariate data representations: a scatterplot with two quantitative attributes or a stacked dot plot with one quantitative and one categorical attribute. However, a wide variety of other representations were expected as well. Interestingly, few tasks referred to these representations by name, but rather gave instructions on what attributes to graph and how to graph them (e.g., “Drag the height attribute to the y-axis”).
Some (12%) of the tasks prompted students to create multivariate representations with three or more attributes simultaneously, for example, by assigning colors to the points on a scatterplot depending on some categorical attribute. Figure 4 presents an example for a dataset regarding plant growth.
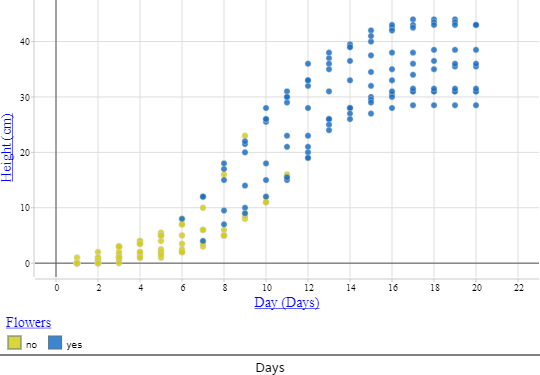
The accompanying task prompted the students to create a scatterplot of height of the plants vs. days of growth with the categorical attribute of whether the plant had flowers or not overlaid. The most common numerical measure students were expected to find was the mean. Measures of spread, such as range, standard deviation, and interquartile range, appeared in relatively few tasks.
The types of questions students asked when analyzing data also varied from task to task. The tasks were analyzed to determine if they included at least one question at each of the levels of graph interpretation — reading the data, reading between the data, reading beyond the data, and reading behind the data — as well as which of the four types of questions were the most prominent in the task (Table 4).
Table 4
Level of Graph Interpretation Called for in the Tasks
| Level of Graph Interpretation | Tasks That Included This Level of Question | Tasks for Which This Level of Question Was Most Prominent |
|---|---|---|
| Reading the data | 58% | 19% |
| Reading between the data | 92% | 63% |
| Reading beyond the data | 45% | 14% |
| Reading behind the data | 23% | 4% |
Nearly all tasks (92%) asked students to read between the data (e.g., “Is there a relationship between money made [gross] and the year the movie was released?”), and for 63% of tasks, this type of question was most prominent. Asking students to read behind or read beyond the data requires those students to attend to context in their answers, which is relevant to Key Aspect 2 as well. For example, one PSMT asked students to read behind the data by asking, “What is different about action and adventure movies that they would need a bigger budget?”
Questions that asked students to read beyond the data took a variety of forms. Sometimes, students were asked to make predictions about other hypothetical cases (e.g., “If I told you that a 5th grade boy usually texts about four hours [per week], about how many text messages do you think he would’ve sent yesterday?”). Some questions asked students to generalize to a larger population (e.g., “Based on [your investigation], what can we infer about the general population? In other words, what can we say about the ages of male Olympic athletes from 1896 to 2016 compared to the ages of female Olympic athletes from 1896 to 2016?”). Others asked students to include the meaning and context of attributes when making decisions (e.g., “What food item[s] would you consider to be the healthiest?”).
Some asked students to consider how attributes were measured and whether the method of measurement might affect their analysis. For example, in one task, students collected data about their own heights and arm spans, and were asked, “What inconsistencies could there be in collecting the data? In other words, how could measuring one person, or a class of people, change?” Still others asked students to consider how a different sample using the same sampling methods might appear similar or different to the sample at hand (e.g., “If we continue to select samples of 15 M&Ms, will we maintain the same distribution?”).
Of the 36 tasks with a driving statistical question, 34 (94%) prompted students to provide an answer to the question at the conclusion of the data analysis. Overall, when students were asked to report or interpret their data analyses, 77% of the assignments referred back to the context of the data (e.g., “Does the data support the statement ‘Students who work a lot do not get to hang out with friends as much as other students’? Why or why not?”), which is also relevant to Key Aspect 2 (continual connection to context). The other 17 (23%) assignments asked questions that did not ask students to interpret answers in context, such as, “Is there a weak, medium, or strong correlation between the two variables?” or “Using the form y = mx + b, write the formula for the line of best fit.”
Discussion
Our study was one of the first to investigate how teachers plan to use a dynamic technology tool like CODAP to engage students in statistical investigations, and it addressed prior calls (e.g., Langrall et al., 2017; Shaughnessy, 2007) to address teachers’ pedagogy for teaching statistics. It was also a sizable study, including a large number of participants (75) from five geographically dispersed teacher education programs.
We investigated how three key aspects emphasized in the ESTEEM materials were reflected in the tasks designed by PSMTs. The design of CODAP supported PSMTs in designing tasks that focused on the investigation of big data, aligning with Key Aspect 1.
In contrast to the small, univariate and bivariate textbook tasks with fictitious data in high school textbooks identified by Weiland (2019), the PSMTs in this study tended to choose datasets that were large, containing an average of 15 attributes and 304 cases, and real. Such datasets would also meet curricular expectations for multivariate datasets (e.g., Public Schools of North Carolina, 2019). Furthermore, most of the datasets included both categorical and quantitative variables, which allowed for rich statistical questions to be posed and modeled the reality of big data collected by businesses and industries today. Students who investigate such datasets would experience a more authentic data investigation.
The findings from this study showed that the teacher-designed tasks were primarily at the level of reading between the data, but that nearly half of the tasks included questions that expected students to read beyond the data. Furthermore, CODAP provided a means for PSMTs to focus students’ work on context as opposed to the labor-intensive practices of calculating numerical analyses and creating graphs by hand or the more rudimentary noncontextual reading of graphs and tables (e.g., reading the data level of graph interpretation only).
Although calculating statistical measures and drawing representations are important skills, students need opportunities to engage in investigations within contexts to develop robust statistical thinking. We also observed instances in which PSMTs directed students’ attention to the context, aligned with Key Aspect 2, which occurred in the orientation to the dataset or through questions that prompted students to make contextualized claims.
Statistics is typically taught as part of the mathematics curriculum. As a result, with regards to Key Aspect 3, curriculum materials often focused on the data analysis phase of the statistical investigation cycle (Jones et al., 2015), because data analysis tends to be more computational and less driven by context. However, the use of technology changes the types of questions that can be asked about data.
The ability to investigate large, multivariate datasets in CODAP allows students to focus less on the computational work of statistics and focus more on making decisions about data analysis, considering different ways to represent the data, and interpreting the data in light of context and data collection methods.
The results from this study suggest that the participating PSMTs attended to multiple phases of the statistical investigation cycle in their task design. Many tasks provided opportunities for students to investigate specific statistical questions or pose their own questions. More than three fourths of the tasks prompted students to interpret the results of their analyses using the context of the problem. The data collection phase was not as prevalent in the tasks as the other three phases, which is not surprising, given that the Task Design Assignment did not require students to collect their own data. However, when investigating data not collected themselves, teachers should help students understand the process of data creation (McClain & Cobb, 2011). Although PSMTs’ tasks provided opportunities for students to discuss the context of the data, few tasks prompted students to consider how the data had been collected or how the collection method might impact their interpretations.
To draw meaningful conclusions from data, students need to understand how the data were collected, what attributes describe, and how the data collection procedures might influence the analysis and interpretation of the analysis results. PSMTs’ attention to data collection could be enhanced by adapting the Task Design Assignment along with other ESTEEM materials.
Although the study’s findings suggest CODAP holds great potential as a tool for teachers to engage students in statistical investigations, there is a limitation to our study. Prior research studies (e.g., Henningsen & Stein, 1997; Stein, Grover, & Henningsen, 1996; Tarr, Chavez, Reys, & Reys, 2006) have highlighted the differences between mathematics tasks as they appear in written curriculum materials, as they are set up and intended by teachers in the classroom, and as they are enacted by teachers and students. These studies’ findings describe the difficulties teachers encounter in setting up and enacting the mathematical tasks as intended, particularly with respect to maintaining the cognitive demand of mathematical tasks.
Our study focused on the intent of the task designed by teachers, rather than the enactment of the task. The PSMTs were asked to design a statistical task and prepare to implement it; however, the PSMTs did not use the tasks with K-12 students. Hence, our study can only speak to what we think students would do in working through the designed tasks rather than what they may actually do when using the tasks.
Implications for Teacher Education
For recent calls (e.g., Boaler & Levitt, 2019) to enhance statistics and data science in the secondary curriculum to be met, preservice teacher education must help PSMTs learn to teach students data analysis skills needed for the 21st century, including the use of technological tools to analyze data. In general, curriculum resources for secondary statistics teacher education have been limited. The existing materials for statistics teacher education tend to focus primarily on developing teachers’ content knowledge (e.g., Peck, Gould, Miller, & Zbiek, 2013; Perkowski & Perkowski, 2007).
The videos, readings, data investigations, and discussions used in the ESTEEM curriculum materials were designed to address PSMTs’ pedagogical content knowledge for statistics, including technological tools for teaching statistics. We based many of our analyses on Tran and Lee’s (2015) framework, and PSMTs using the ESTEEM curriculum materials become familiar with this framework. Mathematics educators can use the framework with PSMTs to support their understanding of the considerations they will face when designing and implementing statistical tasks.
One unique feature of the ESTEEM materials is the integration of the technology tool CODAP. Most of the teachers in the study were unfamiliar with CODAP at the beginning of the semester. With a modest amount of instruction, they became proficient in its use and able to successfully write tasks that utilize the technology. As a relatively new tool, CODAP has the potential to play a crucial role in statistics education in the coming years, and this study shows its promise for doing so.
As teacher educators, we regularly ask teachers to reflect on the quality of the curriculum materials and technological tools they use and consider how they can modify them to differentiate instruction, to create cultural relevance, or to increase academic rigor. Increasingly, teachers are creating their own instructional materials, rather than relying on textbooks (Gorman, 2017). Consequently, teachers are taking on a new role of curriculum designers, and teacher education should include opportunities to support new teachers in designing their own tasks. The Task Design Assignment described in this study models one way mathematics teacher educators can do this.
To prepare teachers to teach data analysis and statistics in schools, the teacher education community must provide opportunities for new teachers to investigate data and reflect on high quality teaching practices for statistics. However, authentic statistical investigations that involve large, multivariate datasets require the use of technological tools such as CODAP. This study has found that the ESTEEM materials, which utilize CODAP and an assessment regarding its use for teaching (the Task Design Assignment), hold promise for supporting new teachers to plan meaningful technology-enhanced data analysis tasks that involve large, multivariate, real datasets and multiple levels of graph interpretation.
The five participating classrooms were diverse in size, audience, and geographic location, which suggests that the ESTEEM materials have the potential to influence diverse groups of preservice teachers. Through engagement in the ESTEEM materials and designing statistical tasks with CODAP, PSMTs will hopefully become more confident in teaching statistics, addressing the concerns expressed by Lovett and Lee (2017).
Acknowledgements
Financial support for this research study was provided by the National
Science Foundation (DUE 1625713) and Eastern Michigan University (Faculty
Research Award to Stephanie Casey, Undergraduate Research Stimulus Program
Award to Jordan Draper).
References
American Statistical Association (n. d.). Census at school. Retrieved from https://ww2.amstat.org/censusatschool/
Association of Mathematics Teacher Educators. (2017). Standards for preparing teachers of mathematics. Retrieved from https://amte.net/standards
Boaler, J., & Levitt, S. (2019, October 23). Modern high school math should be about data science – not Algebra 2. Los Angeles Times. Retrieved from https://www.latimes.com/opinion/story/2019-10-23/math-high-school-algebra-data-statistics
Concord Consortium (2019). Common online data analysis platform (CODAP) [computer software]. Retrieved from https://codap.concord.org/
Curcio, F. (1987). Comprehension of mathematical relationships expressed in graphs. Journal for Research in Mathematics Education, 18(5), 382-393.
Curcio, F. R. (1989). Developing graph comprehension. Elementary and middle school activities. Reston, VA: National Council of Teachers of Mathematics.
Dunn, P. K., Carey, M. D., Farrar, M. B., Richardson, A. M., & McDonald, C. (2017). Introductory statistics textbooks and the GAISE recommendations. The American Statistician, 71(4), 326-335.
Finzer, W. (2002). Fathom dynamic data software. [Computer software]. Emeryville, CA: Key Curriculum Press.
Finzer, W. (2013). The data science education dilemma. Technology Innovations in Statistics Education, 7(2). Retrieved from http://escholarship.org/uc/item/7gv0q9dc
Franklin, C., Bargagliotti, A. E., Case, C. A., Kader, G. D., Schaeffer, R. L., & Spangler, D. A. (2015). The statistical education of teachers. Alexandria, VA: American Statistical Association.
Franklin, C., Kader, G., Mewborn, D., Moreno, J., Peck, R., Perry, M., & Schaeffer, R. (2007). Guidelines for assessment and instruction in statistics education (GAISE) Report: A pre-K-12 curriculum framework. Alexandria, VA: American Statistical Association.
Gorman, N. (2017, February 7). Survey finds teachers spend 7 hours per week searching for instructional materials. Education World. Retrieved from www.educationworld.com.
Henningsen, M., & Stein, M. K. (1997). Mathematical tasks and student cognition: Classroom-based factors that support and inhibit high-level mathematical thinking and learning. Journal for Research in Mathematics Education, 29, 524-549.
Jones, D. L., Brown, M., Dunkle, A., Hixon, L., Yoder, N., & Silbernick, Z. (2015). The statistical content of elementary school mathematics textbooks. Journal of Statistics Education, 23(3).
Konold, C., & Miller, C. (2005). TinkerPlots: Dynamic data exploration. [Computer software]. Emeryville, CA: Key Curriculum Press.
Langrall, C. W., Makar, K., Nilsson, P., & Shaughnessy, J. M. (2017). Teaching and learning probability and statistics: An integrated perspective. In J. Cai (Ed.), Compendium for research in mathematics education (pp. 490-525). Reston, VA: National Council of Teachers of Mathematics.
Lee, H. S. (2019, May). Data science education in 6-12 classrooms: What should could would, but often ain’t there . Presentation at the United States Conference on Teaching Statistics, State College, PA. Retrieved from: https://www.youtube.com/watch?v=53WuS5z3oPY&feature=youtu.be&t=596
Lovett, J. N., & Lee, H. S. (2017). New standards require teaching more statistics: Are preservice secondary mathematics teachers ready? Journal of Teacher Education, 68(3), 299-311.
McClain, K., & Cobb, P. (2001). Supporting students’ ability to reason about data. Educational Studies in Mathematics, 45, 103-129.
National Governors Association Center for Best Practice & Council of Chief State School Officers. (2010). Common core state standards for mathematics (CCSS-M). Washington DC: Author.
Peck, R., Gould, R., Miller, S., & Zbiek, R. (2013). Developing essential understanding of statistics for teaching mathematics in grades 9-12. Reston, VA: National Council of Teachers of Mathematics.
Perkowski, D. A., & Perkowski, M. (2007). Data and probability connections: Mathematics for middle school teachers. Upper Saddle River, NJ: Pearson Prentice Hall.
Public Schools of North Carolina. (2019). North Carolina standard course of study for math 4. Raleigh, NC: Author.
Rossman, A., Chance, B., & Medina, E. (2006). Some key comparisons between statistics and mathematics, and why teachers should care. In Thinking and reasoning with data and chance: Sixty-eighth annual yearbook of the National Council of Teachers of Mathematics (pp. 323-333). Reston, VA: National Council of Teachers of Mathematics.
Shapiro, E. J., Sawyer, A. G., Dick, L. K., & Wismer, T. (2019). Just what online resources are elementary mathematics teachers using? Contemporary Issues in Technology and Teacher Education, 19(4). Retrieved from https://www.citejournal.org/volume-19/issue-4-19/mathematics/just-what-online-resources-are-elementary-mathematics-teachers-using
Shaughnessy, J. M. (2007). Research on statistics learning and reasoning. In F. K. Lester, Jr. (Ed.), Second handbook on mathematics teaching and learning (pp. 957-1009). Charlotte, NC: Information Age Publishing.
Stein, M. K., Grover, B. W., & Henningsen, M. (1996). Building student capacity for mathematical thinking and reasoning: An analysis of mathematical tasks used in reform classrooms. American Educational Research Journal, 33(2), 455-488.
Tarr, J. E., Chavez, O., Reys, R. E., & Reys, B. J. (2006). From the written to the enacted curricula: The intermediary role of middle school mathematics teachers in shaping students’ opportunity to learn. School Science and Mathematics, 106(4), 191-201.
Tran, D., & Lee, H. S. (2015). Considerations for design and implementation of statistics tasks. In Teaching statistics through data investigations MOOC-Ed. Retrieved from http://fi-courses.s3.amazonaws.com/tsdi/unit_3/CDIST.pdf
Weiland, T. (2019). The contextualized
situations constructed for the use of students by school mathematics textbooks. Statistics Education Research Journal, 18(2),
18-38.
Appendix
Task Design Assignment Instructions
The purpose of this assignment is to provide an opportunity for designing a task that illustrates how you can develop students’ statistical thinking utilizing CODAP as a tool.
In preparation for this assignment, review the task development guide and the SASI framework. See an example of a CODAP-enabled task designed using the format of this assignment.
There are six parts to this assignment. All six parts should be in a single document to be submitted. The CODAP file you create to accompany the task will be included through a URL.
The last page of this document contains sample datasets and sites for searching for your own data that may be of interest to you and your students.
Part 1: Introductory Information
Brief Summary of Task: In this activity, students will… (2-4 sentences)
Intended Audience: (List the grade level or specific course.)
Time Needed: (How long should this task take to implement?)
Materials: (List all materials needed by the teacher and students.)
Shared Link to CODAP file:
Directions for creating a shared link:
- In the top left corner of the CODAP page, click the menu button. This button is 3 small horizontal white bars.
- Choose Share -> Get link to shared view.
- A prompt will appear that says: “Sharing view: disabled.” Click the button “Enable Sharing”. This has to be enabled to create a shareable link.
- Copy the shareable link that appears in the next window.
General Statistical Goal (choose one from the list of Statistics Standards to Choose From below)
Specific Learning Objectives for the Task: (List what students should learn and be able to do specifically in this task that will advance them in meeting the General Statistical Goal.)
Sources: Provide a list of sources used in designing the task. This could be a source for where data was obtained (potential data sources are listed below), an article that inspired the approach taken, or a task you found from another source (textbook, website, etc.) and adapted for this assignment.
Part 2: Launch the Task
Describe how you will introduce the task to students.
Part 3: Student Guide/Handout of the Task
Write up the task as you would present it to students in a guide or handout. Provide specific directions and questions for students to answer. (In addition to the handout, these questions or directions could be placed in a textbox within your CODAP file.)
Part 4: Anticipating Students’ Work
Provide 3-4 examples of how students may use CODAP while completing your task. Display a range of student work that include sophisticated and less sophisticated understandings, including one exemplar student response. This description of student work should include either CODAP screenshots or a link to videos of narrated screencasts where you illustrate what students may do in the task.
Part 5: Notes for Implementing the Task
Explain what the teacher should be doing while students are working on the task. List possible questions the teacher may need to ask to support and/or scaffold students’ work on the task. How will you use students’ work to discuss the task and important statistical ideas the task was designed to develop?
Part 6: Reflection
Write a one-page reflection in which you discuss the process you engaged in while creating your CODAP-enabled statistics task. Consider such things as: What process did you go through when creating your task? What were some things you considered during the process and why? What did you find challenging and why? What were the most important thing(s) you learned in the process of designing this task?
Statistics Standards to Choose From
The following standards are adapted from those listed in many State-level standards and the Common Core State Standards for Mathematics. For simplicity, we only provide four broad standards to choose from.
- Compare a quantitative variable among two or more groups and make informal or formal comparative inferences about differences.
For example, compare the height of players on the basketball team to height of players on the soccer team or decide whether the words in a chapter of a seventh-grade science book are generally longer than the words in a chapter of a fourth-grade science book. - Investigate patterns of association in bivariate data (two quantitative variables). Recognize when a linear model is appropriate and use a linear model to make sense of and make predictions in the context of the data. For example, creating a linear model to describe the amount of hours of sunlight a plant gets each day and the growth of a plant in cm, and use the growth rate in the model to make predictions.
- Investigate patterns and trends of association in bivariate categorical data. Use the results to solve problems. For example, collect data from students in your class on whether or not they have a curfew on school nights and whether or not they have assigned chores at home. Is there evidence that those who have a curfew also tend to have chores?
- Use data collected from random samples and random processes to make a claim about a larger population, process, or model. For example, to investigate the heights of males in a school, students could take a random sample of 50 males and use that sample to make inferences about a model of the distribution of heights of males at that school. To investigate sampling variability, each person in a class could randomly select 20 males from the school and then as a class examine the distribution of mean heights from each sample in order to make some claim about typical heights as well as heights that would be considered unusual. For a process example, if students flip a water bottle repeatedly and keep track of the various landing positions, they may be able to make an inference about a model for the proportion of times they should expect a bottle to land upright. Or, what if a model says a spinning coin falls tails up with probability 0.6. Would a result of 8 tails in a row cause you to question the model? Students could use an app to create a model with a 0.6 of success (tail) and generate multiple samples of 8 coin spins and consider how unusual it is to get 8 tails by collecting the number of tails in each sample of 8 and graphing those results. Is getting 8 tails enough to reject the model of 0.6 chance of getting tails?
Example Datasets
(In order to upload data into CODAP, the data must be a CSV file.)
- CensusAtSchool
- Census at School is an international project that has involved students from all over the world who complete an online survey and submit the data to a very large database. The survey asks questions such as which hand students use to write with, foot length, gender, etc. The website has a sampler feature that can be used to quickly download a subset of the data.
- United Nations Human Development Reports
- This data is part of the United Nations Development Program. On this site users first can choose from many dimensions to analyze data from over 150 different countries. There are over 10 dimensions to choose from including education, health, and inequality.
- Fatal Encounters
- This is a dataset that contains over 24,000 records of police involved encounters collected since January 1, 2010 to present. It is not a comprehensive dataset, rather one created and sourced by volunteers from around the United States.
- 120 Years of Olympic History
- This is a historical dataset on the modern Olympic Games, including all the Games from Athens 1896 to Rio 2016. It includes 15 variables (categorical and quantitative).
- Movies
- Three decades of movie data (1986-2016) from the Internet Movie Database. It includes over 3,000 movies and 14 variables (categorical and quantitative). Free account registration required.
Example Sites for Searching for Datasets
(Note: Be sure to download data in a CSV file format. Some datasets at these sites may need to be cleaned.)
- Data.gov
- This is the home of the U.S. government’s open data. Here you can search over 300,000 datasets.
- Google Dataset Search
- Dataset Search enables users to find datasets stored across thousands of repositories on the Web, making these datasets universally accessible and useful.
- Kaggle.com
- Kaggle is a public data platform used by data scientists and machine learners to upload and share clean datasets. In order to use the site you will have to create a free account.
- Data.world
- This is also a public data platform where people can upload and share data. Here you can browse data on topics ranging from finance to health to sports and politics. To download any datasets you will have to create a free account.
![]()